Monthly cost accounting
A complete feature guide for the monthly cost accounting workbench. From first-in, first-out (FIFO) material cost calculation and automatic verification to anomaly detection and difference journal entries, this guide explains how to dramatically streamline monthly financial closing for small and medium-sized manufacturers.
What this feature can do
This function calculates the actual cost required for monthly financial reporting in the manufacturing industry.
- Material costs are calculated using the First-In, First-Out (FIFO) method, where materials are consumed sequentially in lot units.
- Labor costs are calculated based on actual working hours, and indirect costs are calculated according to allocation rules, and these are included in the cost of goods sold.
- You can review the difference between standard cost and actual cost, and also compare it with the previous month.
FIFO (First-In, First-Out): A method of calculating costs by assuming that materials are used in the order they were purchased. It is one of the industry standard calculation methods.
Traditionally, many small and medium-sized manufacturers have used spreadsheets to calculate monthly costs, manually performing first-in, first-out (FIFO) calculations for material costs, spending more than half a day allocating indirect costs, and finally visually verifying the calculations—a burdensome process that they repeat every month. This function allows you to perform this entire process with a single click, and the system completes everything, including automatic verification.
Screen URL:
- Cost Workbench:
/app/costing-workbench - Execution Workbench:
/app/costing-execution-workbench
Three challenges this feature solves
Problem 1: Cost accounting stops due to missing data entry at the site.
In manufacturing environments, performance data is sometimes registered without the information linking each task to "which final product it is intended for."
Solution for this system: Automated inference for the final product
During cost calculation, the system automatically traces back the process tree for each container (unit of work-in-progress) and infers and completes the final product code. This prevents cost "getting lost" without increasing the input burden on the factory floor.
Problem 2: Indirect cost allocation results in errors in irregular months
"This month, production was zero due to maintenance, but indirect costs were incurred." — In cases like this, the allocation calculation can result in a division by zero error, which can halt the monthly closing process.
Solution for this system: Automatic avoidance of division by zero
The allocation service does not generate an error even if production figures are zero. Instead, it automatically allocates indirect costs to the ending work-in-process inventory (remaining work-in-process inventory). If there is no ending work-in-process inventory, it is recorded as unallocated in the verification log, and the decision is left to the person in charge.
Challenge 3: Monthly processing is a one-shot deal and scary.
"The calculations turned out to be wrong, but there's no going back"—this kind of fear is a major source of stress during monthly financial closing.
Solution for this system: Non-destructive "back-bookkeeping" method
This feature does not rewrite any of the standard inventory ledgers or accounting ledgers in ERPNext. Because calculations are performed on an independent "back-end ledger," you can modify allocation rules and actual data and recalculate as many times as you like. It is designed to be safe by posting only the final confirmed difference as a journal entry.
Overall Flow
期間を作成 → 期首残高を繰越 → 計算を実行 → 検算 → 差額レビュー → 仕訳作成 → 期間をクローズ
List of related screens
| Screen | URL | Purpose |
|---|---|---|
| Cost Workbench | /app/costing-workbench | Creating, managing, and calculating time periods |
| Execution Workbench | /app/costing-execution-workbench | Check the calculation progress |
| Material Consumption Flow | /app/costing-fifo-flow | Consumption order and unit price trends of materials (first-in, first-out) |
| Work-in-Progress Inventory Summary | /app/costing-wip-summary | Work-in-Process Costs by Process and Item |
| Work-in-Progress (by element) | /app/costing-wip-element Breakdown of material costs, labor costs, and indirect costs | |
| Opening Balance | /app/costing-opening-wip | Confirmation and Carryover of Beginning Work-in-Process Inventory Balance |
| Allocation Preview | /app/costing-allocation-preview | Indirect Cost Allocation Simulation |
| Allocation Results | /app/costing-allocation-result | Confirmation of results after allocation |
| Verification Summary | /app/costing-validation-summary | Cost consistency check results |
| Verification Details | /app/costing-validation-detail | Individual details of verification errors |
| Price Difference Review | /app/costing-variance-review | Difference between standard cost and actual cost / compared to the previous month |
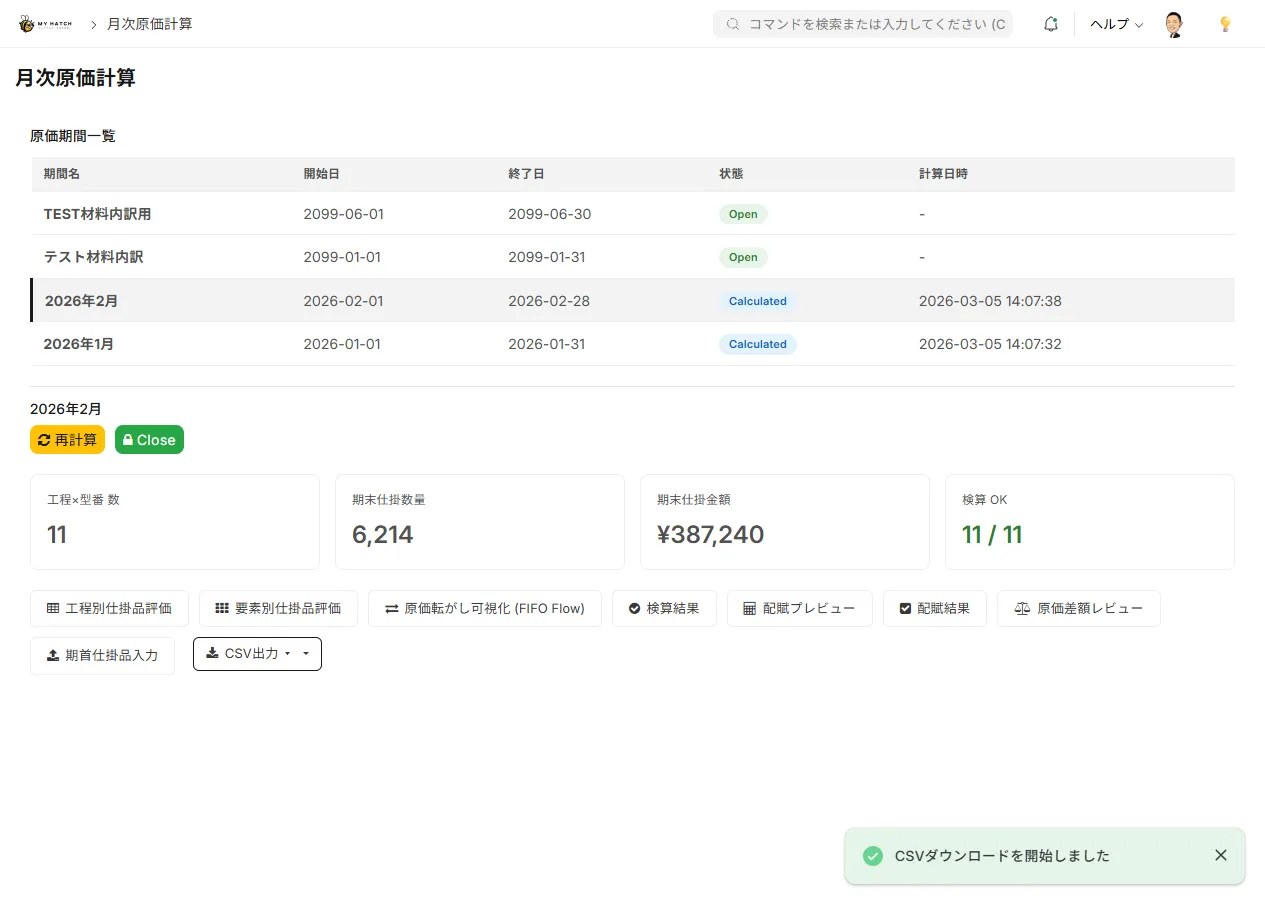
Operating Procedure
Step 1: Create cost periods
1./app/costing-workbench Open
2. Click the "New Period" button.
3. Select the target month and year (e.g., January 2026)
4. The cost period is created in an "open" state.
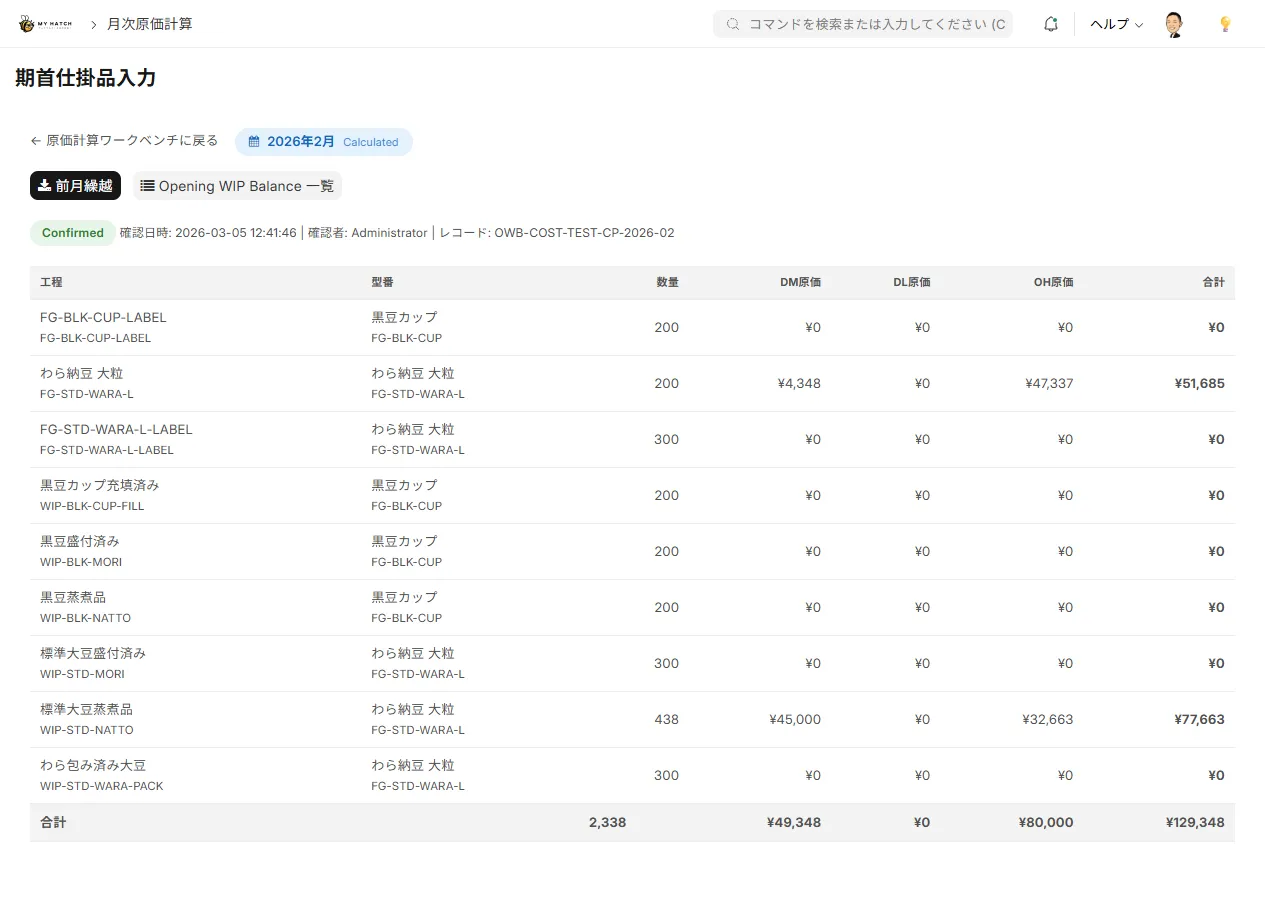
Step 2: Carry forward the opening balance
- Click the "Beginning Balance Carryover" button.
- The work-in-progress balance at the end of the previous month is automatically copied as the beginning balance for the current month.
Confirmation screen:/app/costing-opening-wip
| Item | Contents |
|---|---|
| Item Code | Work-in-Progress Item |
| Lot Number | Lot Identifier |
| Quantity | Carryover Quantity |
| Material Costs | Material costs at the beginning of the period |
| Labor Costs | Labor costs at the beginning of the period |
| Indirect Costs | Indirect Costs at the Beginning of the Period |
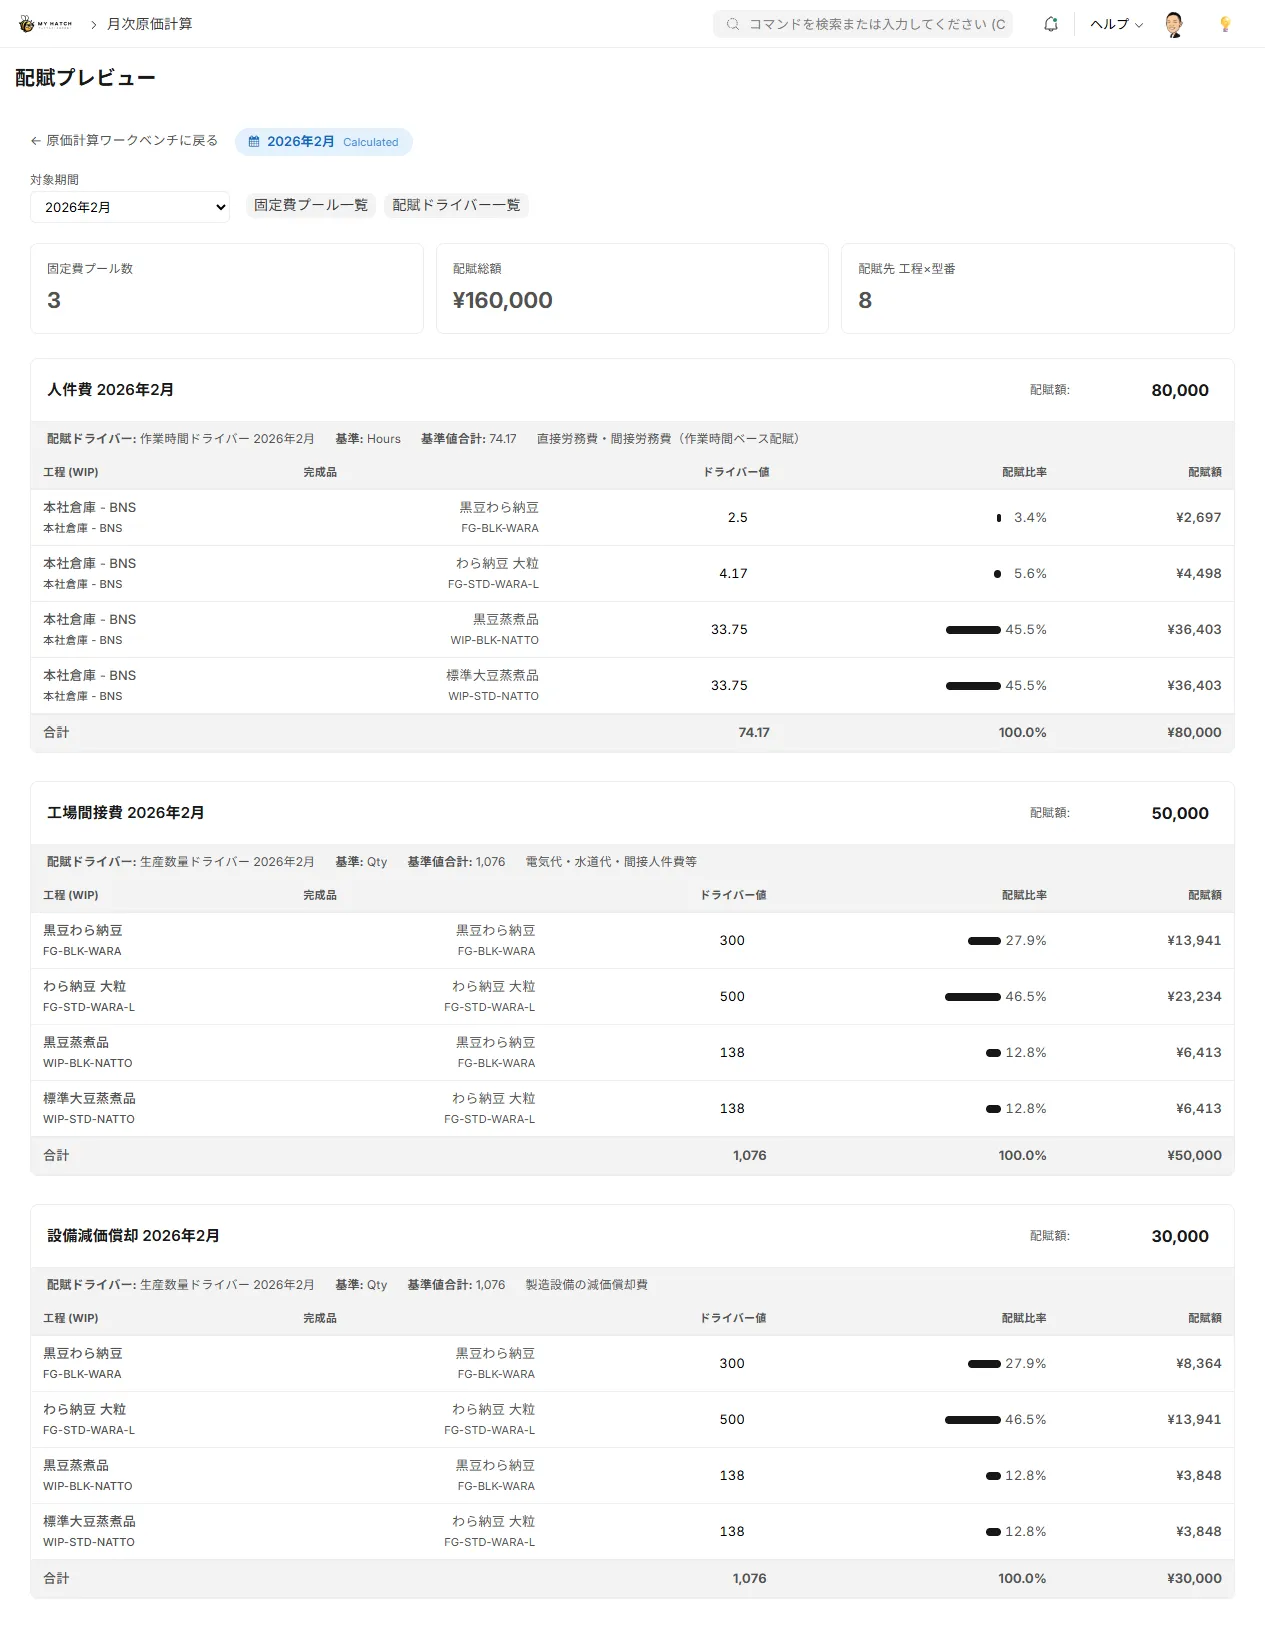
Step 3: Check the allocation of indirect costs in the allocation preview (optional)
Before performing the actual calculations, you can simulate the allocation of indirect costs.
1./app/costing-allocation-preview Open
2. Check and edit the amount of the indirect cost pool.
3. Check the value of the allocation driver (allocation criteria).
4. Preview the allocation amount and percentage for each item.
5. Modify the values as needed and click "Save" to apply the changes.
Step 4: Perform cost accounting
- Click the "Execute Cost Calculation" button.
- The calculation starts in the background.
- The progress bar displays the progress of the calculation steps in real time.
You can perform other tasks in your browser while the calculation is in progress. You will be notified by an alert when it is complete.
Steps in Cost Accounting
The calculation process is executed sequentially in the following 8 steps. Users only need to check the progress bar to see the status.
| Step | Processing Details |
|---|---|
| 0 | Load opening balance |
| 1 | Extract the movement of work-in-progress (collect container creation and consumption history) |
| 2 | Identify which finished product each container leads to |
| 3 | Track the order of raw material consumption using first-in, first-out (FIFO) method |
| 4 | Calculate material costs (using first-in, first-out unit prices) |
| 5 | Calculate labor costs (working hours × hourly rate) |
| 6 | Allocate indirect costs (proportionately according to allocation rules) |
| 7 | Cost of work-in-progress is compiled by process and item |
| 8 | Verification (checking the consistency of costs) |
Checking Progress
The progress of each step is reflected on the screen in real time.
| Display | Contents |
|---|---|
| Step Name | Currently Executing Step |
| Number of items processed | Number of items processed / Total number of items |
| Overall progress | 0% → 100% |
The three elements of cost
① Material cost (direct material cost)
- Total the value of the materials (lots) consumed in each process.
- Calculated using the First-In, First-Out (FIFO) method, assuming consumption in the order of oldest purchases.
- The unit price in the receipt record will be used as the basis for the calculation.
② Labor costs (direct labor costs)
- The actual work time is calculated from the time records on the process cards.
- Calculated as: Equipment hourly rate × Actual hours worked
- It is allocated to each process (work in progress).
③ Indirect costs (manufacturing overhead costs)
- Register the expense items and amounts in the indirect expense pool (utilities, equipment depreciation, etc.).
- Allocation based on allocation drivers (numerical values used as allocation criteria: work time, production quantity, etc.)
- Calculation formula: Indirect costs × (Allocation base value for the target item ÷ Sum of allocation base values for all items)
Advanced analytical capabilities to identify opportunities for cost improvement
Monthly cost accounting isn't just about "getting the numbers and being done with it." This system incorporates a mechanism to automatically detect cost anomalies and areas for improvement.
Automatic detection of abnormal lot numbers
Material consumption flow screen (/app/costing-fifo-flow The system compares the unit price for each lot to the average unit price and automatically displays a warning mark (⚠) for lots with a deviation rate exceeding 20%. This allows you to instantly identify input errors or abnormal price increases from a vast amount of lot data.

Understanding the cost of defective waste (scrap)
While typical systems treat the cost of defective products as zero, this system logically allocates the material and processing costs invested in defective products. This allows you to accurately determine "how much monetary loss was incurred due to defects this month" and numerically evaluate the cost-effectiveness of quality improvement measures.
Material Cost Drill-Down Tracking
"The cost of this semi-finished product is high, but which raw material is the cause?" — To answer questions like this, we can break down material costs using a proportional allocation based on the amount of material consumed, and trace the factors causing the cost increase in a tree-like structure.
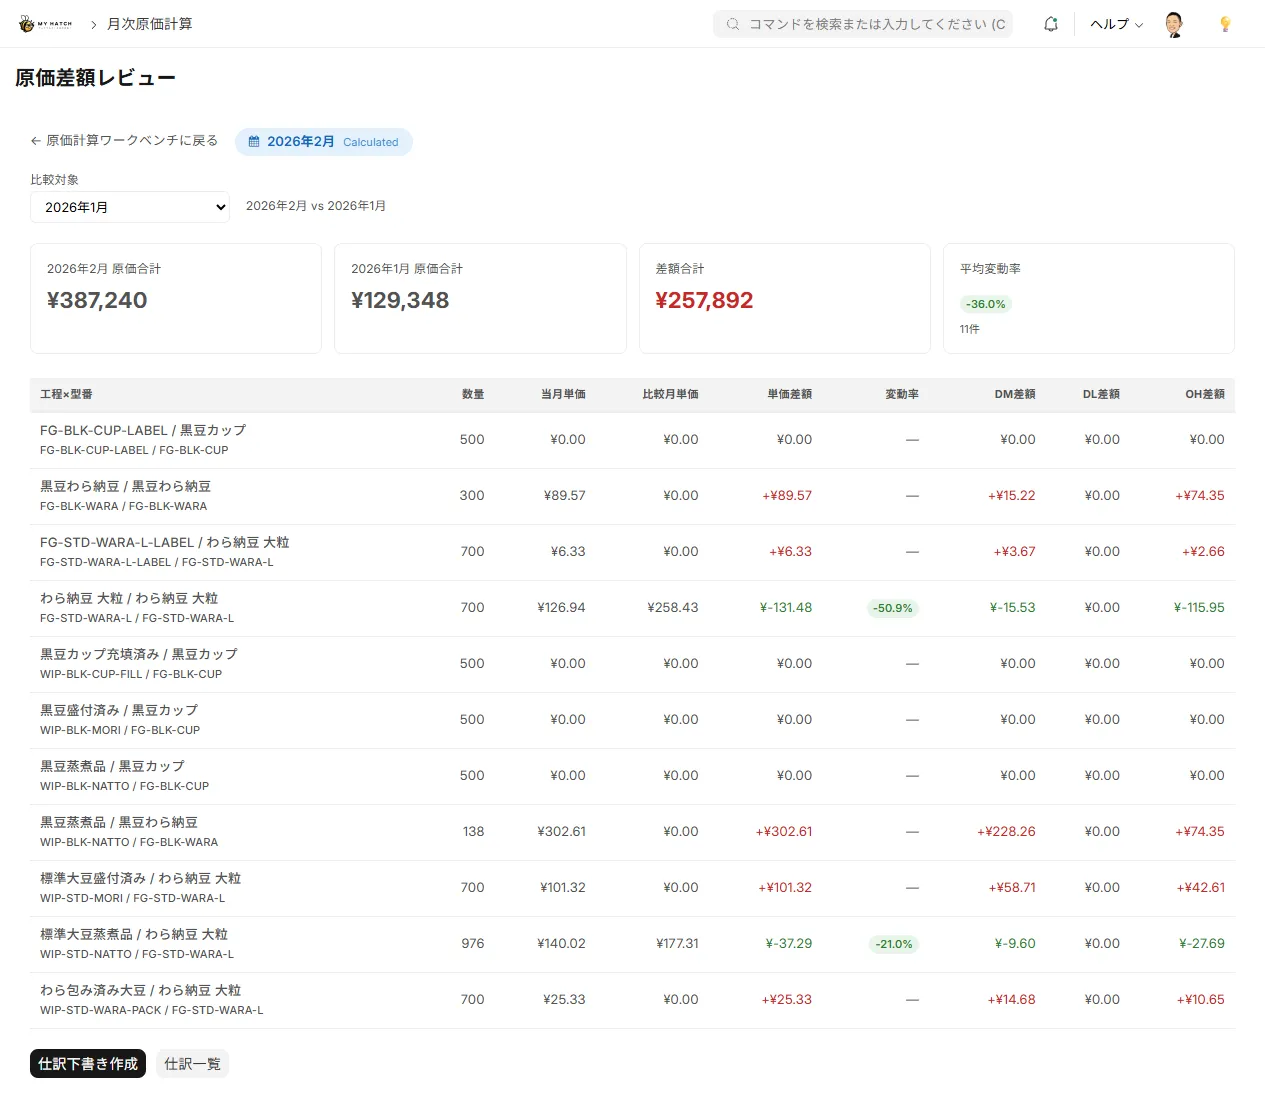
Review compared to the previous month
Difference Review Screen (/app/costing-variance-review This feature automatically compares the costs of the current month and the comparison month, broken down into three components: material costs, labor costs, and indirect costs. The fluctuation rate badge display allows you to easily identify processes and product numbers with significant cost fluctuations.
| Display items | Contents |
|---|---|
| Current month's unit price / Comparison month's unit price | Unit price trend by process and model number |
| Unit price difference | Fluctuation in absolute amount |
| Fluctuation Rate | Percentage Display (Color-coded Badges) |
| Difference between material costs, labor costs, and indirect costs | Breakdown of fluctuations by three elements |
Eliminate manual verification with 3-layer automated verification.
In the final step of cost accounting (Step 8), the system automatically performs the following consistency checks. This eliminates the manual verification work that was previously done by humans in spreadsheets.
| Checklist | Content |
|---|---|
| Debit and Credit Balance | Input Cost = Cost of Finished Goods + Cost of Ending Work-in-Process Inventory |
| Material Cost Consistency | Total materials consumed using the first-in, first-out (FIFO) method = Total materials cost recorded |
| Quantity Matching | Input Quantity = Finished Quantity + Work in Progress Quantity + Loss Quantity |
The verification result is/app/costing-validation-summary The list is displayed, and if there is an error, the cause and the affected data are shown on the details screen./app/costing-validation-detail You can check it there.

Results Confirmation Screen
Material Consumption Flow
/app/costing-fifo-flowThis allows us to visualize the consumption of materials over time.
| Item | Contents |
|---|---|
| Lot Number | Lot Identifier |
| Purchase date | Material arrival date |
| Purchase price | Unit price in receiving record |
| Input Quantity | Beginning Balance + Purchases for the Current Month |
| Consumption | Quantity consumed this month |
| Remaining balance | End-of-month balance |
| Breakdown by Material | Breakdown of how much of each material was consumed in each process |
CSV Download: You can export the data as a CSV file using the "CSV Download" button.
Work-in-Progress Inventory Summary
/app/costing-wip-summaryThis allows you to check the work-in-progress cost by process and item.
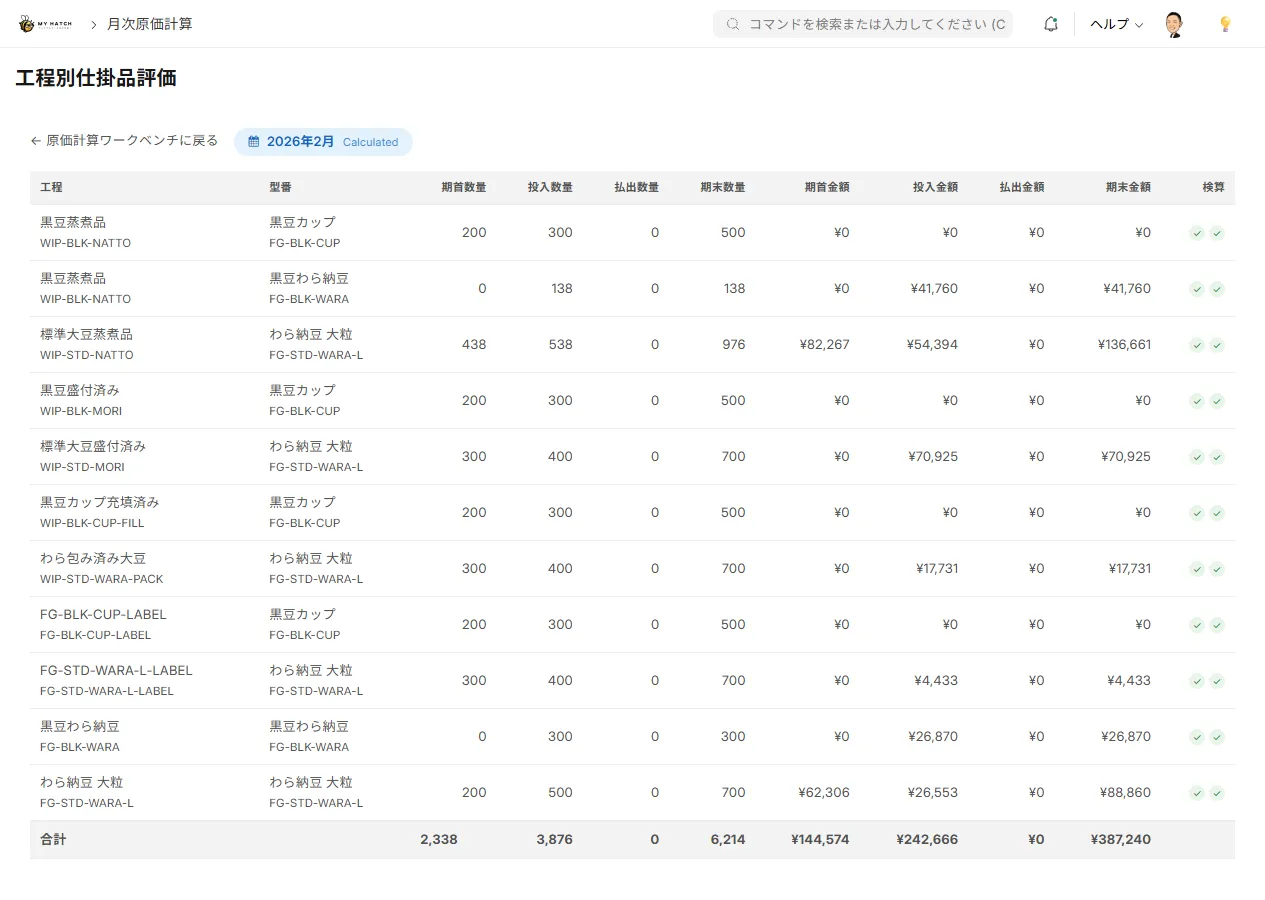
| Item | Contents |
|---|---|
| Final Product | Item Code of the Finished Product |
| Process (Work in Progress) | Work in Progress Item Code |
| Material cost | Direct material cost |
| Labor costs | Direct labor costs |
| Overhead | Manufacturing overhead |
| Total Cost | Sum of 3 Elements |
| Quantity | Quantity of work-in-progress |
| Unit Price | Total Cost ÷ Quantity |
Work in Progress (by element)
/app/costing-wip-elementNext, we will show the breakdown of work-in-progress costs by three elements: material costs, labor costs, and indirect costs.

Price Difference Review
/app/costing-variance-reviewThis allows us to analyze the difference between standard cost and actual cost.
| Comparison axis | Contents |
|---|---|
| Difference in material costs | Standard material cost (BOM) vs. First-in, first-out (FIFO) actual material cost |
| Difference in labor costs | Standard processing costs vs. Actual labor costs |
| Difference in indirect costs | Standard indirect costs vs. Actual indirect costs after allocation |
| Total Difference | Sum of 3 Elements |
Review compared to the previous month
We will compare the results with those of the previous month and analyze the factors influencing the cost fluctuations.
| Item | Contents |
|---|---|
| This month's/Previous month's cost | Comparison by material costs, labor costs, and indirect costs |
| Difference between fluctuation amount and absolute amount | |
| Rate of change | Difference in percentage |
Creating the difference journal entry
Clicking the "Create Journal Entry Draft" button on the difference review screen will automatically generate a cost difference journal entry to adjust the difference between the back ledger and the standard ledger.
- Create a draft journal entry on the difference review screen.
- Set up variance accounts and cost centers in cost variance journal entries.
- After approval, post the entry to the general ledger as a journal entry.
Closing of Period
Once cost accounting is complete and there are no problems with the verification, the period is closed.
- Click the "Close Period" button.
- The status of the cost period changes to "closed".
- Once closed, changes cannot be made in principle (only administrators can reopen it).
CSV Output
You can export the following data as an Excel-compatible CSV file (UTF-8 with BOM) from the "CSV Output" menu in the workbench.
| CSV Type | Content |
|---|---|
| Material Consumption Lot | Cost Details by Lot (with Deviation Rate and Anomaly Flag) + Cost Waterfall |
| Work-in-Process Inventory Valuation by Process | Beginning, Input, Output, and Ending Quantities and Costs for Each Process and Part Number |
| Allocation Results | Details of Indirect Cost Allocation |
| Cost Difference Details | List of Differences Between Backbook and Standard Ledger |
| Container history details | Cost traceability per container |
| Cost breakdown by product | Cost summary for each final product |
| Labor Costs and Time by Process | Working Hours and Labor Costs for Each Process |
| Details of auxiliary material consumption | Amount and cost of auxiliary materials consumed |
| Monthly Trends | Monthly Cost Trends |
Tips for Use
- Recalculation is always possible: Even during periods marked as "calculated," you can recalculate using the "Recalculate" button. You can try again as many times as you like after modifying allocation rules or correcting actual data.
- Other operations are possible even while calculations are in progress: Cost calculation runs in the background, so you can operate other business screens even while calculations are being performed. Progress is updated in real time every 3 seconds.
- Period Reopening: If an error is found, the administrator can reopen the period and recalculate it (the reopening history is automatically recorded).
- Calculation Version Control: Each time a recalculation is performed, the version number is incremented, and when and by whom the calculation was performed is recorded.
- Creating journal entries for the difference: From the difference review screen, you can automatically generate journal entries to adjust the difference by selecting "Create draft journal entry".
- CSV Output: Material consumption flow data can be exported as a CSV file for detailed analysis in Excel.
- Automatic recovery in case of errors: If an error occurs during calculation, the status will change to "Failed" and the error details will be saved. After correcting the cause, you can resume by clicking the "Recalculate" button.