Production Proposal Dashboard
This is an operation manual for the production suggestion screen, which automatically analyzes inventory, demand, and equipment capacity to guide you on "what and how much to produce today."
Do you have any of these problems?
- Morning production planning takes more than 30 minutes, and in the end, it's all based on intuition and experience.
- "Out of stock" and "overproduction leading to waste" occur simultaneously.
- The plan exceeded the capacity of the fermentation room, causing chaos on site.
- The criteria for deciding which items to prioritize are dependent on individual employees, which causes problems when the person in charge is absent.
The production proposal dashboard automatically integrates and analyzes inventory, demand forecasts, equipment capacity, and expiration dates to guide you in making clear decisions about whether to "produce, wait and see, or not produce."
Screen URL:/app/production-dashboard

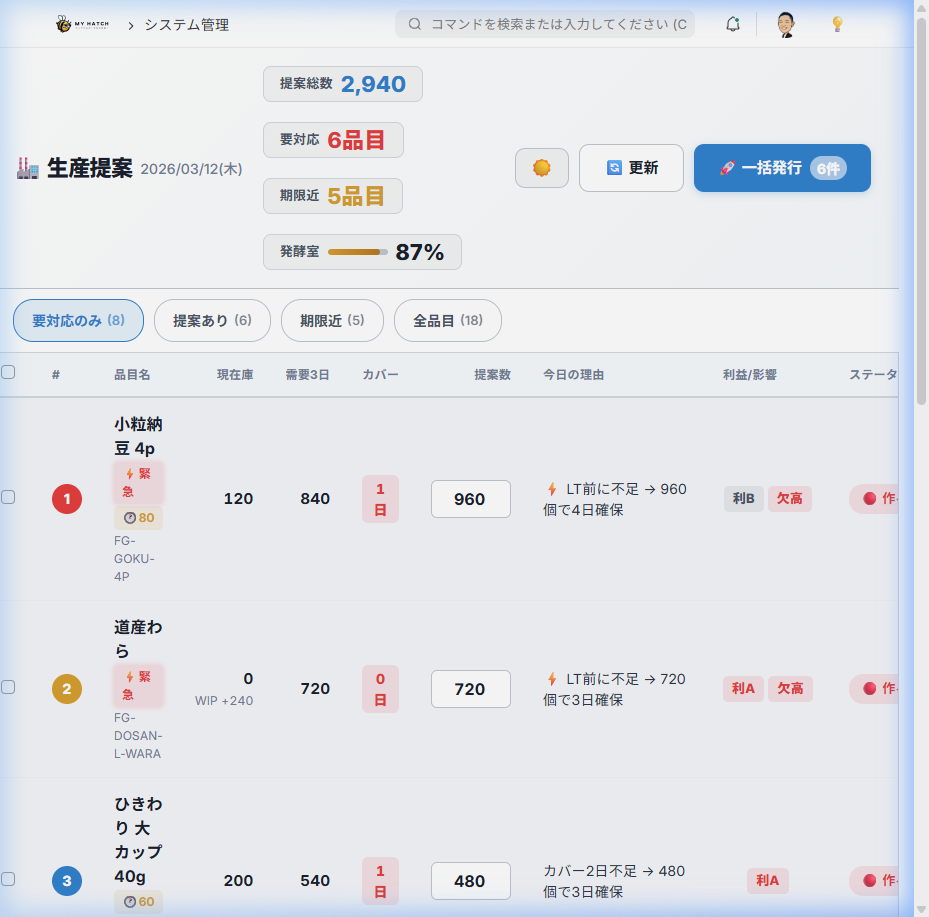
Overall view of the screen
The screen is divided into four main areas.
| Area | Role |
|---|---|
| ① Decision Summary Bar (Fixed at the top) | A quick overview of today's total number of proposals, number of items requiring action, approaching deadlines, and fermentation room usage rate |
| ② Bottleneck Zone (Conditional Display) | When the fermentation room capacity is exceeded, a red warning zone will display the excess rate and the main contributing factor. |
| ③ Filter Bar | Switch between: Action Required Only / Suggestion Available / Nearing Expiration Date / All Items |
| ④ Item List (Main Table) | Compare the priority, inventory, demand, and proposed quantity for each item in a single row. |
| ⑤ Right Drawer (Item Details) | Opens when you click a row in the main table; this contains the data supporting the decision. |
① Decision Summary Bar (Fixed at Top)
It is fixed at the top of the screen, allowing you to get an overview of today's events in an instant.
| Display items | Contents |
|---|---|
| Total number of proposals | Total quantity of production proposals for today |
| Requires Action | Number of items requiring action (🔴 Must be made + 🟡 Wait and see) |
| Approaching Expiration Date | Number of items in stock with an expiration date of within 3 days |
| Fermentation Room Gauge | Real-time display of fermentation room usage as a percentage and gauge bar |
On the far right of the summary bar are the "🔄 Update" button and the "🚀 Batch Issue" button.
② Bottleneck Zone (Conditional Display)
If the proposed quantity exceeds the fermentation room capacity (13,104 packs), a red warning band will display the excess rate and the main contributing item. This allows you to see at a glance which item is causing the load, enabling you to immediately decide on quantity adjustments.
③ Filter bar
| Filter | Content |
|---|---|
| Only items requiring action | 🔴 Show only items that should be made + 🟡 Wait and see + 🔵 Show only items to use up existing stock (default) |
| Proposal Included | Only items for which a production quantity has been proposed |
| Approaching Expiration Date | Only items with stock that will expire within 3 days |
| All Items | Show all items, including those with no issues |
④ Item List (Main Table)
Each item is displayed on a single line, allowing you to compare the following information in a single row.
| Column | Content |
|---|---|
| # (Priority) | System-calculated priority of response. 1st place is red, 2nd place is orange, 3rd place is blue badge. |
| Item Name | Item name and code. ⚡ Urgent / 🕐 Nearing Expiration Alert Badge |
| Current Inventory | Current product inventory. If there is work-in-progress, "Work-in-Progress + Quantity" will be listed. |
| Demand for the next 3 days | Total demand for the next 3 days. 🔮 If there is a badge, it shows the percentage derived from AI prediction (Prophet). |
| Cover | Badges indicate how many days' worth of coverage is currently available (Red = 1 day or less, Yellow = Insufficient, Gray = OK) |
| Number of Proposals | Production quantity of system proposals. Directly editable (See below) |
| Today's Reason | Summarize "Why Make/Don't Make" in one line |
| Profit/Impact | Badges indicating profit rank (Profit A/Profit B) and stockout impact (Stockout High) |
| Status | 🔴 Should make / 🟡 Wait and see / 🔵 Prioritize using up existing stock / ⚪ Do not make |
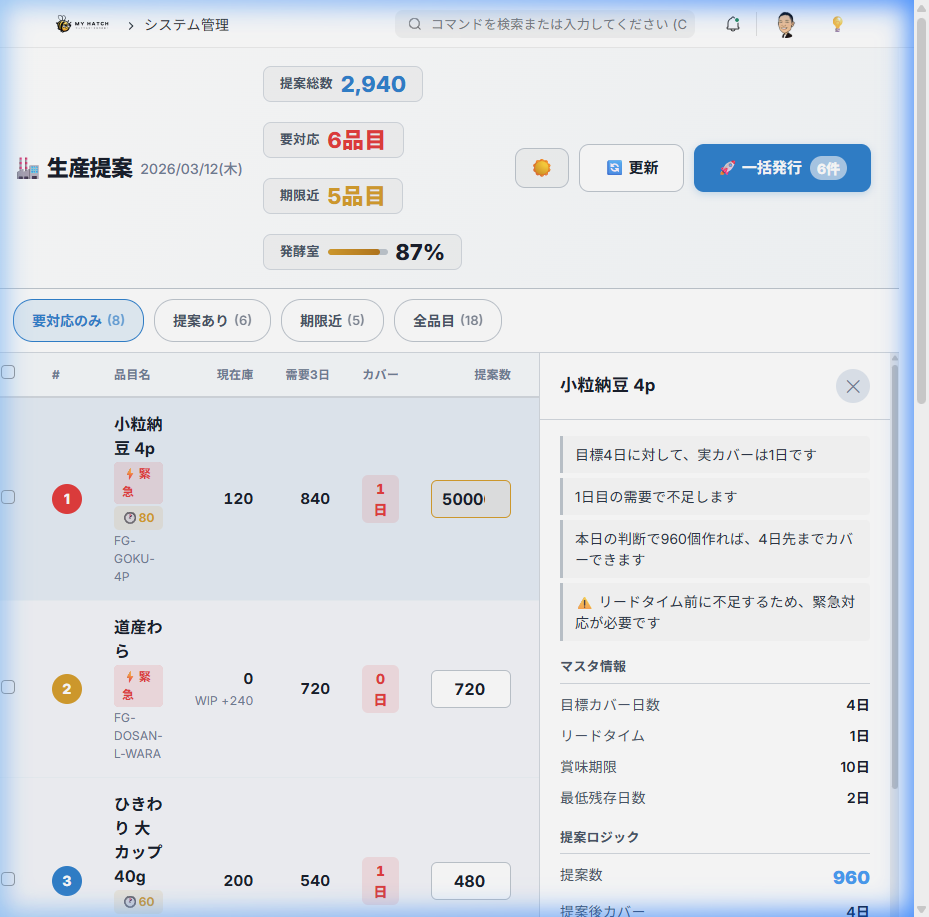
⑤ Right drawer (item details and supporting documentation)
Clicking on an item row in the main table will expand a drawer on the right, allowing you to view the supporting data for the proposal.
| Section | Content |
|---|---|
| Message | Summary of assessments such as "Actual coverage: 1 day against a target of 3 days" and "Shortage before lead time → Emergency response required" |
| Master Information | Target coverage days, lead time, expiration date, minimum remaining days |
| Proposal Logic | Number of proposals and "Coverage days after proposal" |
| Daily Demand | Displays confirmed demand, forecast demand, and total demand for the next 8 days in a daily table. |
| Stock Lots | Quantity, expiration date, and best-before date for each lot. Expired lots are highlighted in red. |
| In Progress | Quantity and expected completion date of ongoing manufacturing orders |
| Daily Simulation | Simulates the daily inventory changes using "D+0, D+1, D+2...". ❌ Clear shortage days |
Four Judgment Statuses
| Status | Icon | Judgment Criteria |
|---|---|---|
| To be produced | 🔴 | Coverage days are below target, production is needed |
| Wait and See | 🟡 | The cover is barely holding up. No production needed today, but monitoring is required. |
| Prioritize clearing out inventory | 🔵 | We have enough covers, but some are nearing their expiration date. We recommend shipping them out first. |
| No production required | ⚪ | Target coverage days have been fully achieved. No production needed. |
The decision is automatically calculated based on five variables: Inventory × Demand Forecast × Work in Progress × Lead Time × Expiry Date.
Main Operations
1. Confirm the basis for the items (open the drawer)
- Click the item row in the main table.
- The right drawer expands, displaying daily demand, inventory lots, and simulations.
- Check the message field to see "Why this decision was made?"
- Click the same row again, or press the ESC key to close the drawer.
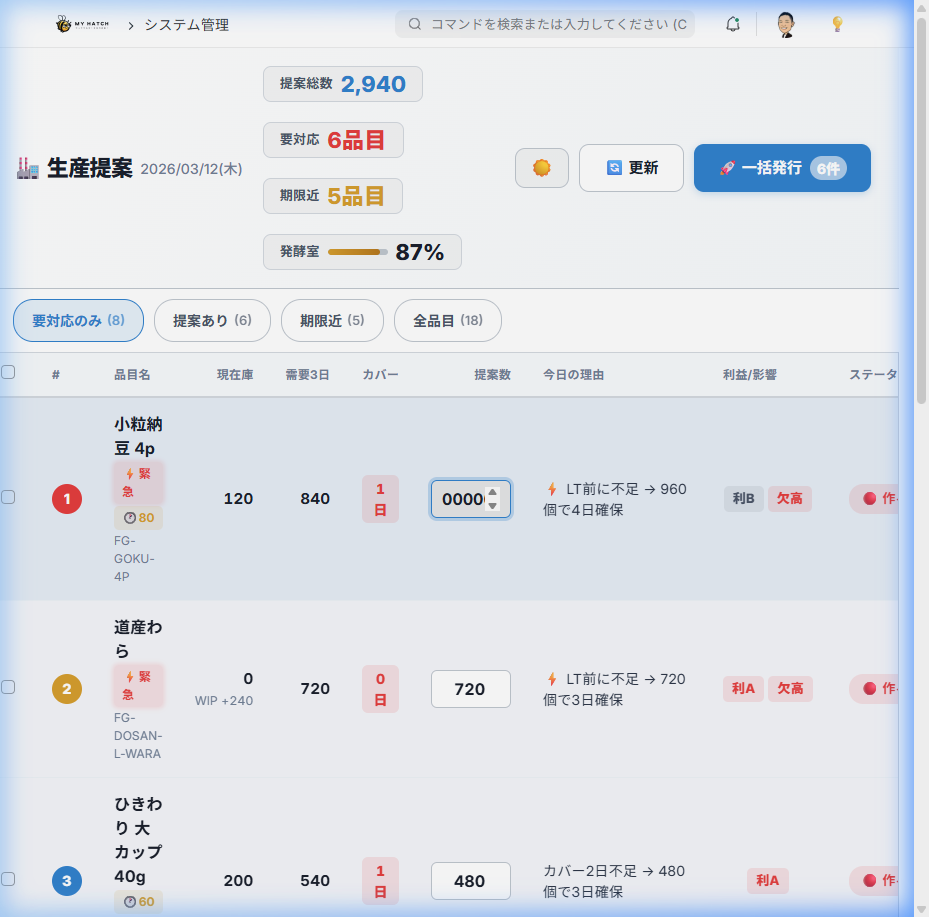
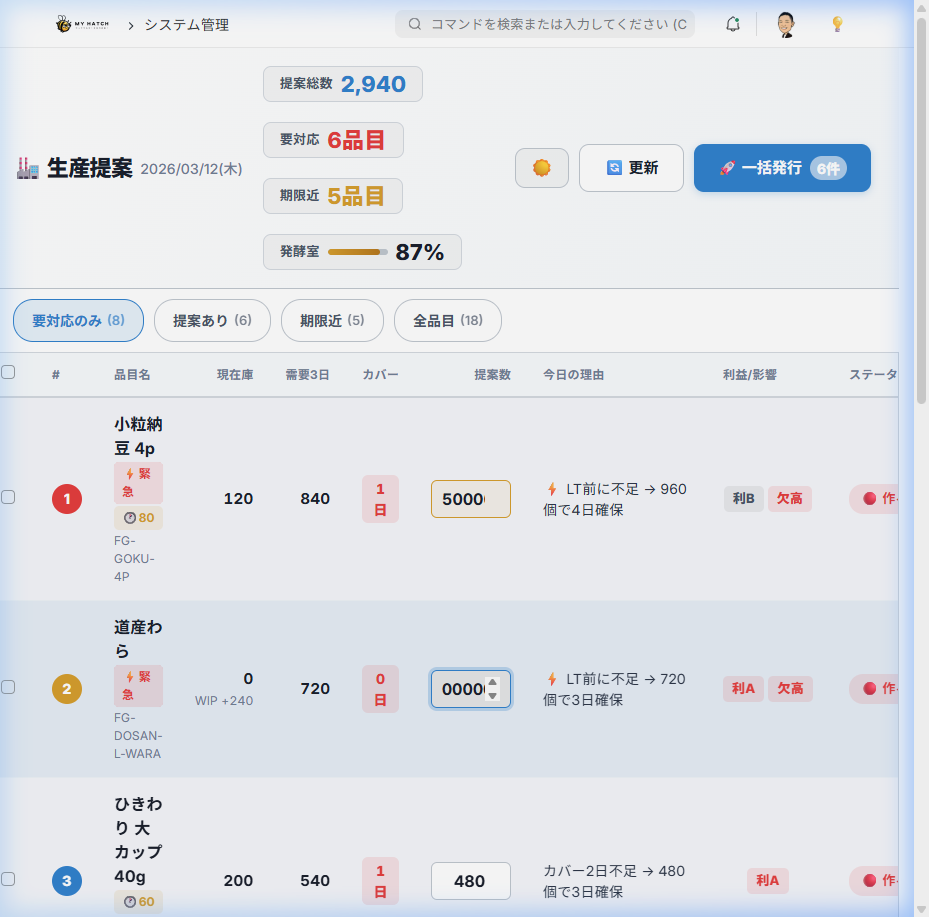
2. Manual adjustment of proposed quantities (direct editing)
The quantity of the system proposal can be changed on the spot at the discretion of the person in charge.
- Click the input field in the "Number of Proposals" column of the main table.
- Edit the quantity directly.
- Changed cells are highlighted in yellow.
For items with a history of past adjustments:📊 +15% (360) A corrected recommendation like the one shown will appear. This is a recommended value that has learned from the decision-making tendencies of past employees.
3. Individual creation of production instructions
You can create production orders (manufacturing orders) one item at a time from within the drawer.
- Click the item row to expand the drawer.
- Click the "✅ Create Production Order" button at the bottom of the drawer.
- Confirm and adjust the quantity in the confirmation dialog.
- Click "Create"

The manufacturing order that was created is List of manufacturing orders You can check and arrange it there.
4. Batch Issuance (Creating Production Orders in a Batch)
This feature allows you to create production instructions for multiple items in one click.
- Check the checkboxes for the items you wish to include (if omitted, all items with suggestions will be included).
- Click the "🚀 Bulk Issue" button on the far right of the summary bar.
- Confirm the list of items and quantities in the confirmation dialog.
- Clicking "Yes" will execute the batch creation.

Processing details:
- Automatically retrieves the default bill of materials (BOM) for each item and creates and submits a draft manufacturing order.
- If a manually adjusted quantity exists, that value will be used.
- The correction history (original number of proposals vs. actual number issued) is automatically saved in the background.
- Success/failure results are displayed as a count.
5. Theme Switching (Dark/Light)
You can switch between dark mode and light mode using the 🌙/☀️ button in the summary bar. Your settings will be saved in your browser and retained for future visits.
Fermentation Room Capacity Management
This system provides real-time visualization and management of the physical capacity of the fermentation room, which is the biggest bottleneck in natto production.
| Item | Contents |
|---|---|
| Total Capacity | 13,104 packs (3 rooms x 13 carts x 14 tiers x 24 packs) |
| Current Usage Calculation | Estimated from the total of ongoing manufacturing orders (incomplete finished products) |
| Gauge Color Coding | Green = Plenty of margin / Yellow = 70% or more / Red = 90% or more (exceeding limit) |
| Display in case of excess | The excess rate and main contributing items are displayed in the bottleneck zone. |
Manually adjusting the proposed quantity is immediately reflected in the gauge, allowing you to simulate whether you have enough equipment to produce this amount before issuing the order.
Business Decision Support Functions
Profit Rank × Stockout Impact Triage
It assists in making sophisticated decisions about "which items to prioritize" when production capacity or materials are insufficient and it is not possible to produce all items.
| Badge | Meaning |
|---|---|
| Profit A | Top-selling items with high profit margins |
| Profit B | Items with a medium profit margin |
| Out of Stock | Items whose stock shortage would have a significant impact on customers |
Items that are profitable (A) and in short supply can be judged as highest priority for production.
AI demand forecasting (Prophet) cooperation
If a portion of the demand originates from Prophet (time-series AI forecasting), the 🔮 badge will show the percentage of forecast-derived demand (e.g.,🔮35% ). This allows for decision-making based on prediction accuracy.
Correction Learning Recommendation
The system learns from the history of how the person in charge has revised system proposals in the past, and recommendations such as "📊 Based on previous trends, +15% is recommended" will be displayed below the number of proposals. This system accumulates knowledge based on individual judgment.
Integration from "Production Proposal" to "Manufacturing Order List"
The production instructions created on the production proposal dashboard are List of manufacturing orders It will be linked to.
生産提案ダッシュボード           製造指図一覧
┌──────────────────┐          ┌──────────────────┐
│ 何を・いくつ作るか │  → 指図 →│ 材料引当・設備割当 │
│ を判断・発行       │          │ で現場Ready化     │
└──────────────────┘          └──────────────────┘
   経営・計画 の視点              工場長・手配 の視点
This two-tiered approach clearly separates the planning layer (demand x supply assessment) and the execution layer (resource x material arrangement), enabling even small and medium-sized enterprises to achieve both a high level of division of labor and seamless information sharing.
Tips for Use
- Morning 5-Minute Decision-Making Meeting: Display only items requiring action using the summaryr and filters → Check the fermentation room gauge → Issue all orders at once. The morning meeting is completed in just 5 minutes.
- Collapse of items with no issues: When filtered as "Action Required Only," items with no issues are collapsed to avoid clutter. They can be expanded by toggling "Show Items with No Issues" when needed.
- ESC key: Pressing the ESC key while the drawer is open will close it instantly.
- Demo Mode: URL
?demoEnabling this will allow you to experience the screen with demo data (this will not affect your actual field data).