Demand forecasting (AI forecasting, demand calendar)
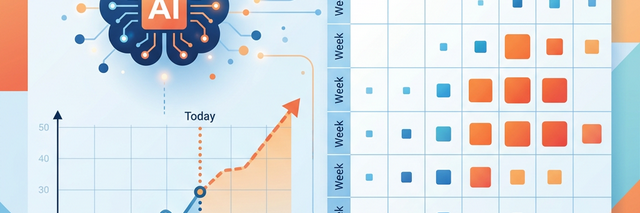
This presentation explains how AI predicts future demand based on past sales data, taking into account the impact of events such as e-commerce sales, and uses this information to inform production planning. It covers the overall picture of the prediction engine, demand calendar, and accuracy feedback.
Related Articles This article explains the mechanism and overall picture of demand forecasting. Please refer to the following for actual screen operations. - Demand calendar : Overview of monthly demand, production, and sales - Prediction Accuracy Dashboard Visualize the difference between predictions and actual results. - Setting up demand forecasts : Management of prediction parameters and data sources
How to reflect this in order progress Order progress board Please refer to the following.
What you can do on this screen
Demand forecasting is a system that uses historical sales data and AI statistical models (Prophet (time-series AI forecasting)) to predict "how much of each item will sell next week and the week after," and uses this information for production planning. Prophet is a time-series forecasting library developed and released by Meta (formerly Facebook), and is used worldwide to forecast seasonal data such as sales and demand.
We will transform our production volume estimations, which previously relied on intuition and experience, into highly accurate estimates using a hybrid approach combining AI and the CEO's experience.
Key points on this page
- AI automatically forecasts demand from sales data: Based on past performance, it automatically calculates the sales volume of each item for the following week.
- Automatically incorporates the impact of e-commerce sales: Automatically detects events such as Rakuten Super Sale and displays suggestions for increased production.
- The more you use it, the smarter the AI becomes: It automatically learns from the discrepancies between predictions and actual results, improving the accuracy of future predictions.
Screen URL:/app/demand-calendar ,/app/forecast-adjustment

Three challenges that demand forecasting can solve
| Up until now (intuition and experience) | → | From now on (AI + experience) |
|---|---|---|
| "Make the same amount as last week" → Out of stock during the sale period | → | A suggestion to +35% increase production is automatically generated before the sale |
| "Let's make extra year-end gifts..." (a rough estimate) | → | AI calculates a specific quantity based on data from the past 3 years |
| Missing Rakuten's sale leads to delayed response | → | Automatically detect e-commerce events to be aware of them in advance |
| No retracement even if the prediction is wrong | → | Prediction accuracy is automatically measured and the AI automatically adjusts internal parameters |
Overall Flow
This outlines the workflow from demand forecasting to production instructions. AI generates a draft, which is then refined based on the CEO's experience.
過去の販売データ → AI予測(Prophet) → 社長が微調整 → 生産提案に自動反映
       ↑                                ↓
ECイベント自動収集 ← 予測精度フィードバック ← 実績との比較
| Steps | What to do | Time required |
|---|---|---|
| Event Check | Check this month's EC sales and events on the demand calendar | 1 minute |
| Check AI predictions | Check AI predicted quantities on the prediction dashboard | 1 minute |
| Fine-tuning quantities | Bulk adjustments such as +10% during sale periods and -5% during quieter weeks | 2 minutes |
| Use in production proposals | Forecast values are automatically reflected in the order progress board (no operation required) | Automatic |
Scene 1: Get an overview of the month using the demand calendar
The demand calendar is a dashboard that allows you to see the monthly situation from five perspectives on a single screen. Open it first thing each week to get an overview of the month.
Screen URL:/app/demand-calendar
5 tabs
| Tabs | What you can see |
|---|---|
| Demand Events | E-commerce events such as Rakuten sales and year-end gift giveaways are displayed on the calendar as colored bars. Includes impact (e.g., +35%) and suggestions for increasing production. |
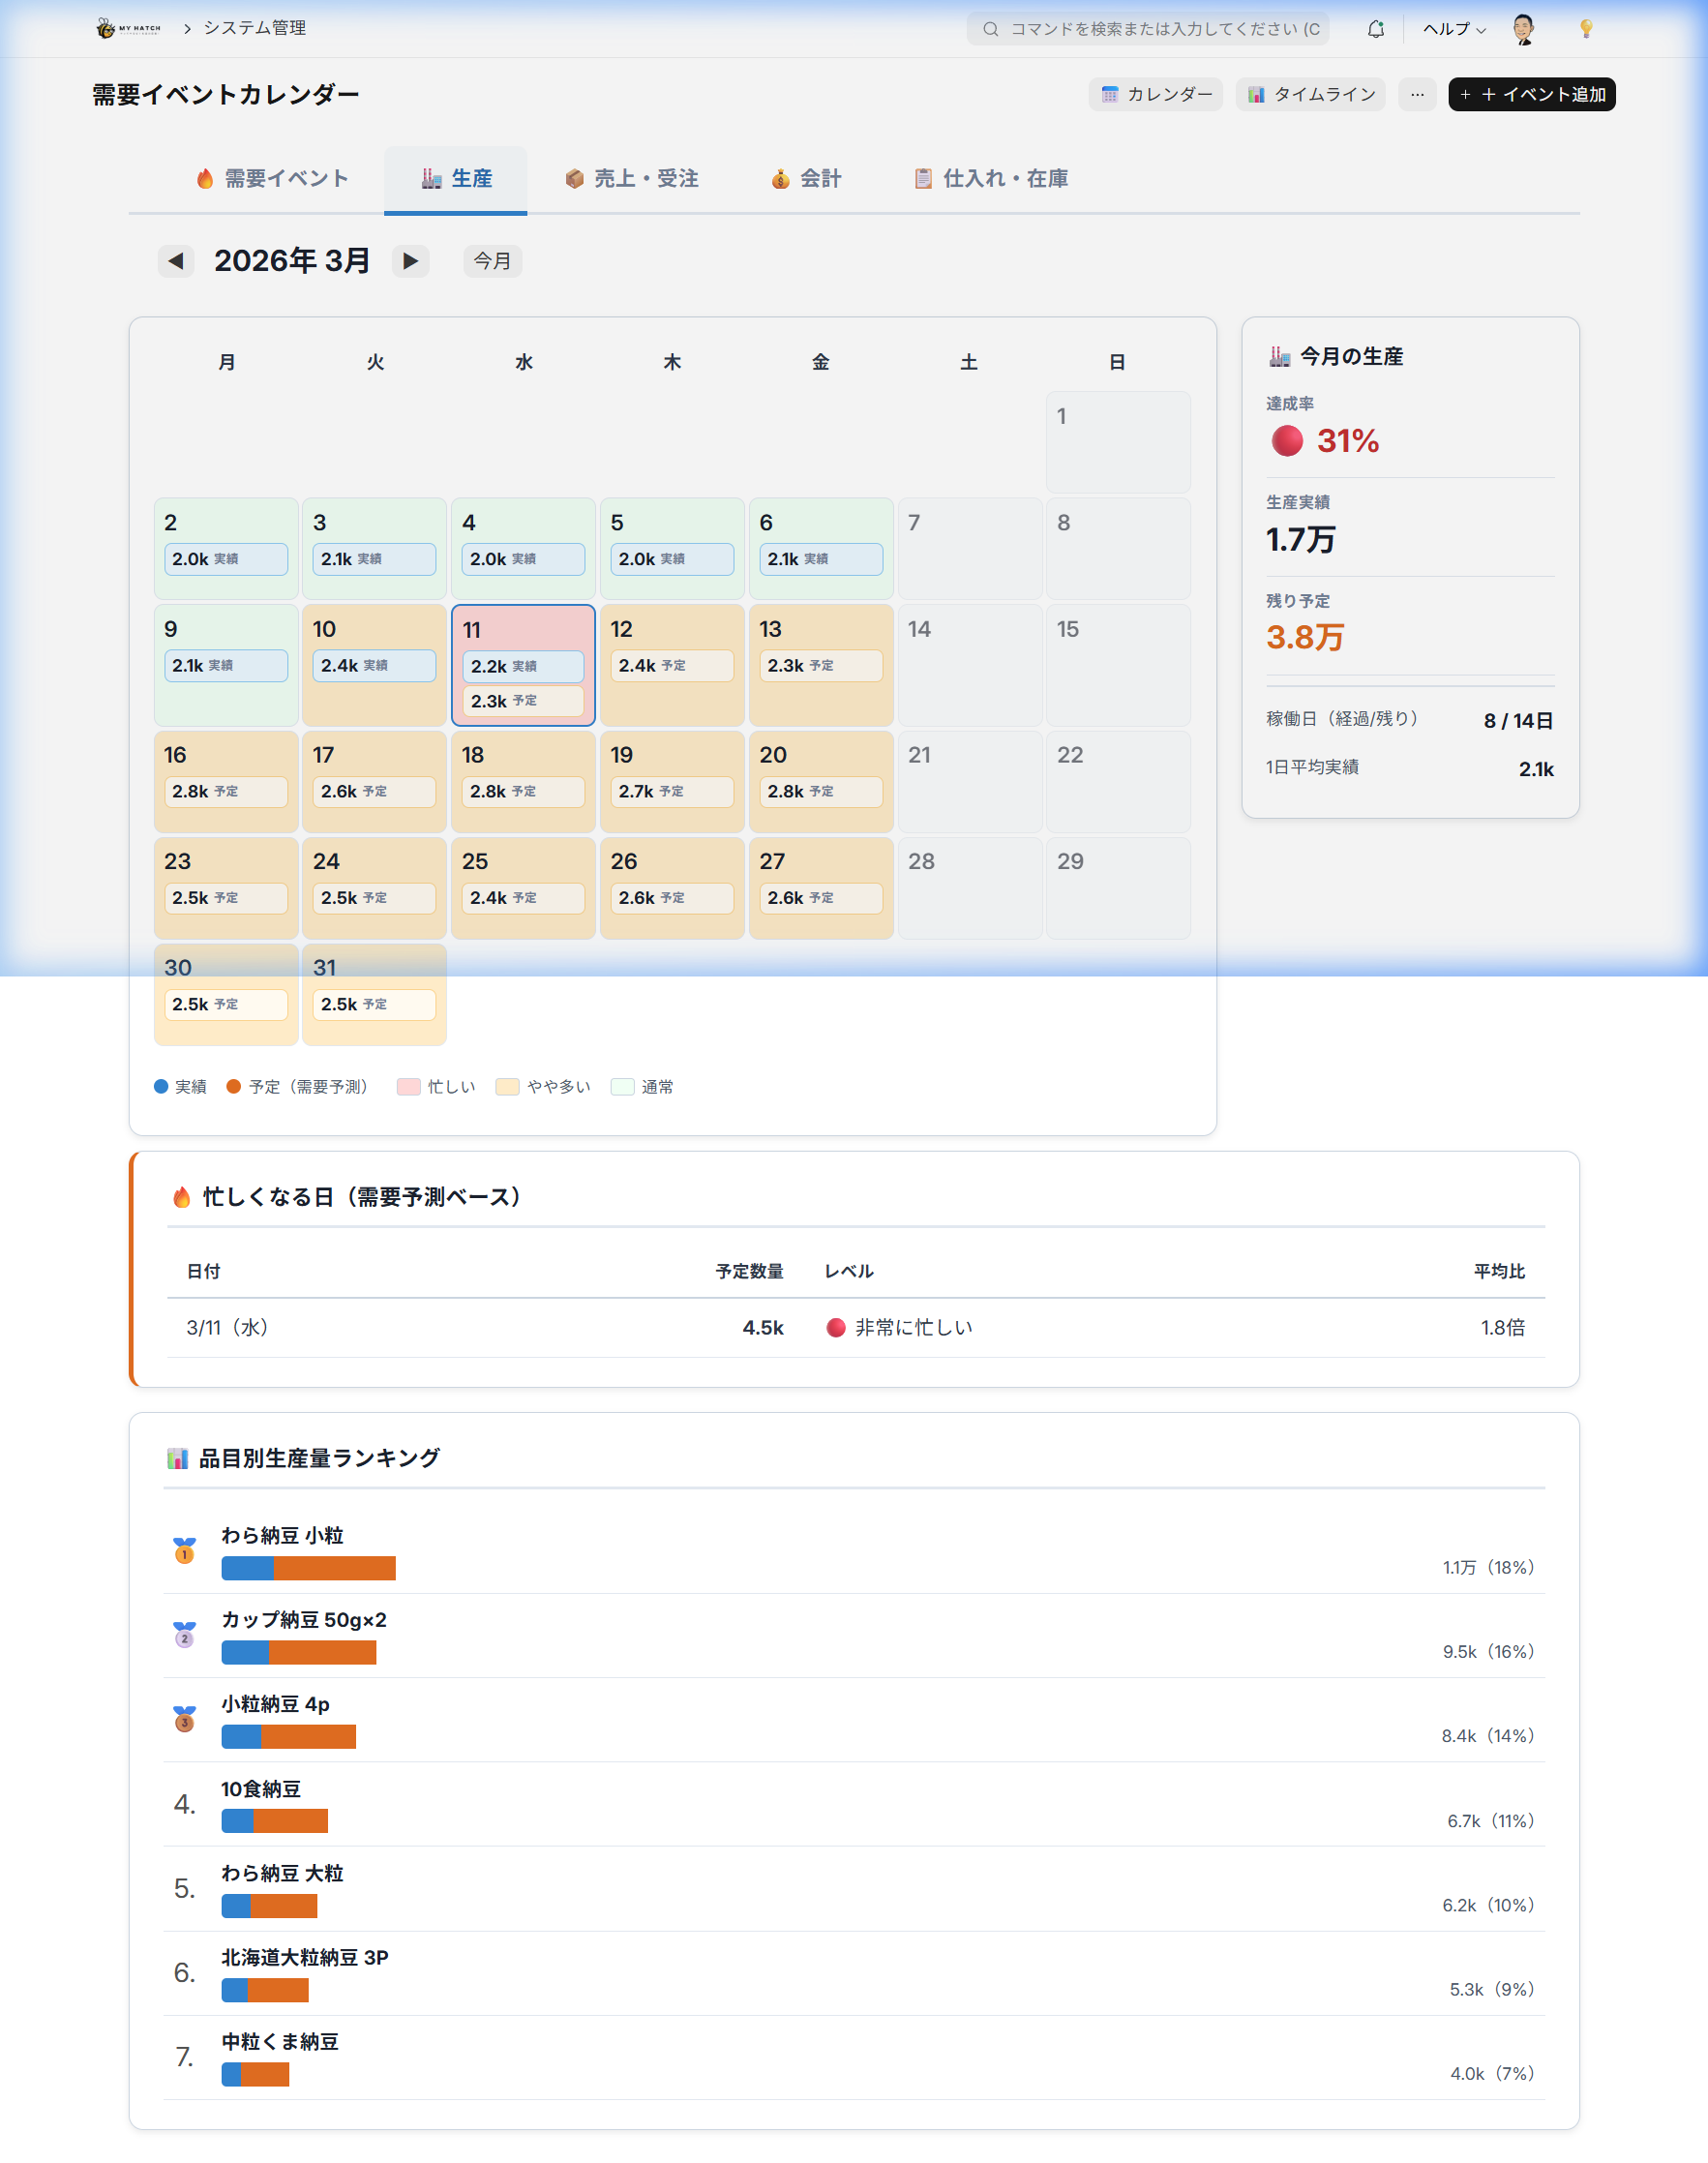
| Production | Daily production volume is displayed on a heatmap. See the ranking of busy days and items at a glance. |
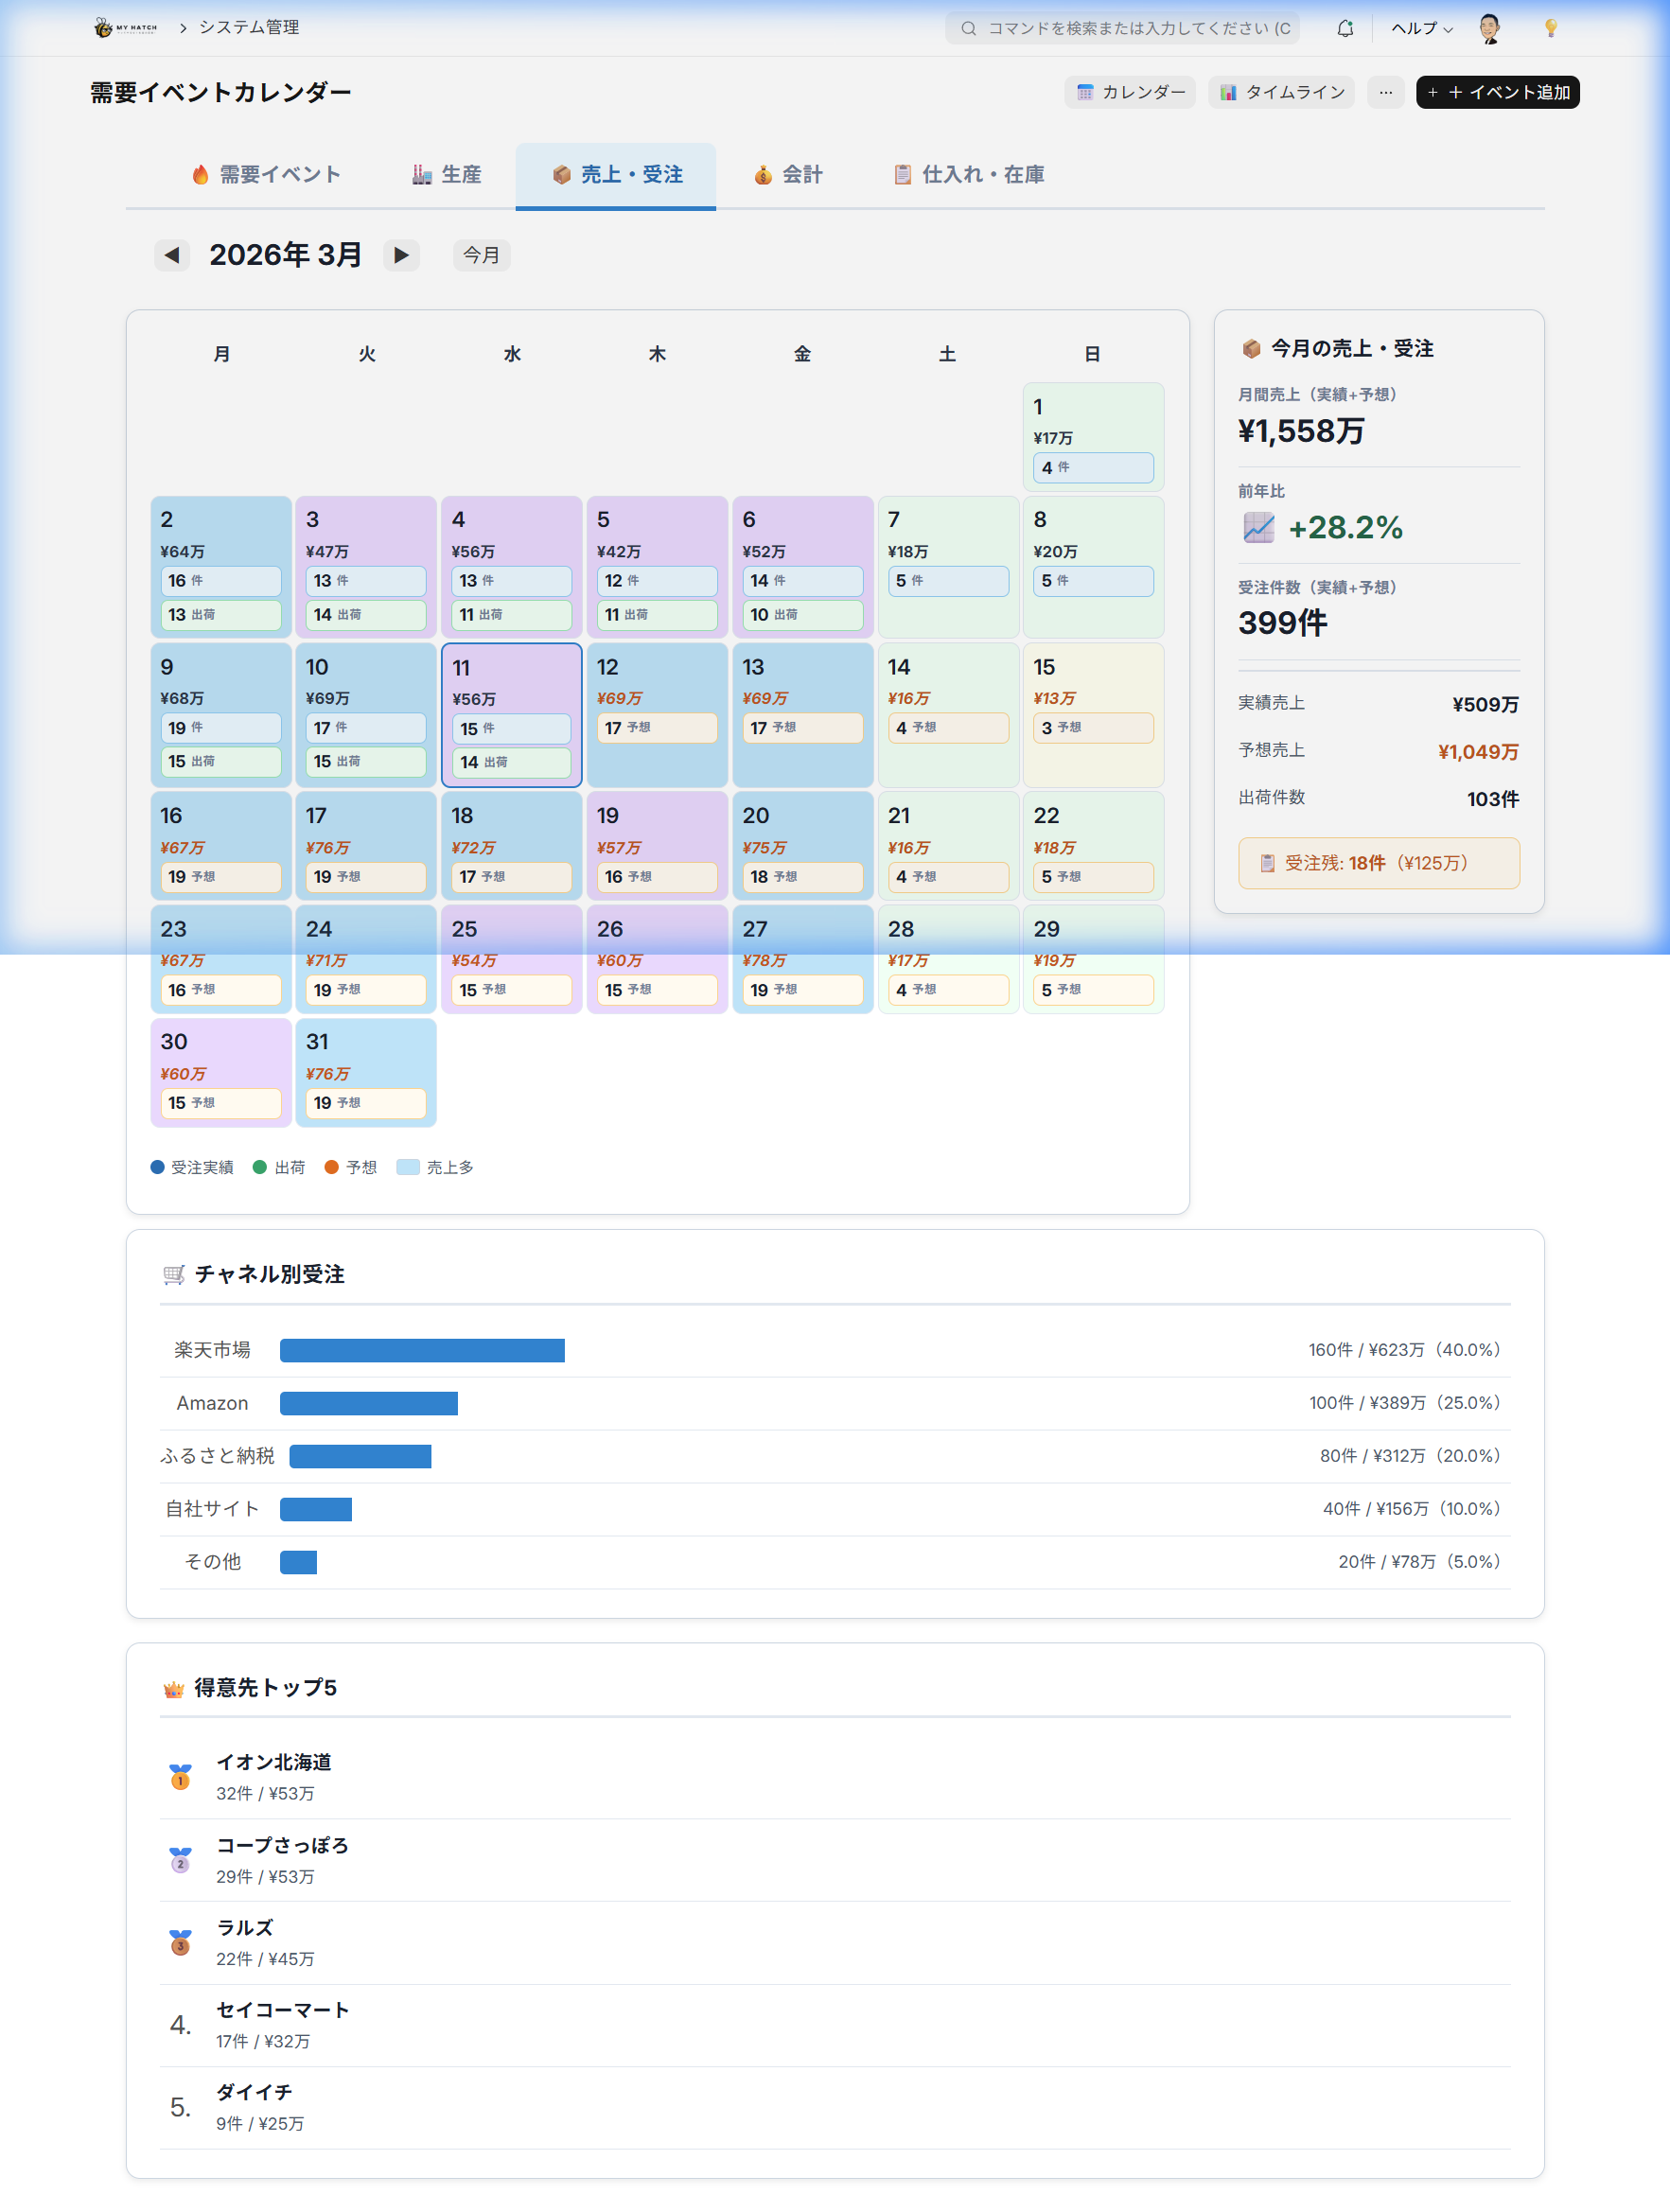
| Sales and Orders | Trends in the number and value of orders. Breakdown by e-commerce channel (Rakuten / Amazon / Yahoo!) |
| Accounting | Display income and expenditure timings on a calendar. Check your cash flow plan. |
| Procurement & Inventory | Inventory status of ordered items, ordering timing, and expiration date alerts |
Production Tab: Displays daily production volume in a heatmap, with item-specific rankings:
Sales & Orders Tab: Order breakdown and customer rankings by e-commerce channel:
Things to do
- Open the demand calendar.
- Check the event bar for this month in the Demand Events tab.
- Check the production increase rate by item group in the This Month's Proposal panel on the right.
- Briefly review the other tabs (production, sales, accounting, purchasing) to get an overall picture.
The Past and the Future
| Up until now | Up to now |
|---|---|
| View Rakuten, Amazon, and Yahoo! from separate management screens | 5 tabs on one screen for a comprehensive overview of all channels |
| Manually check sale information on each site | Events are automatically displayed on the calendar |
Scene 2: Automatically collect e-commerce events
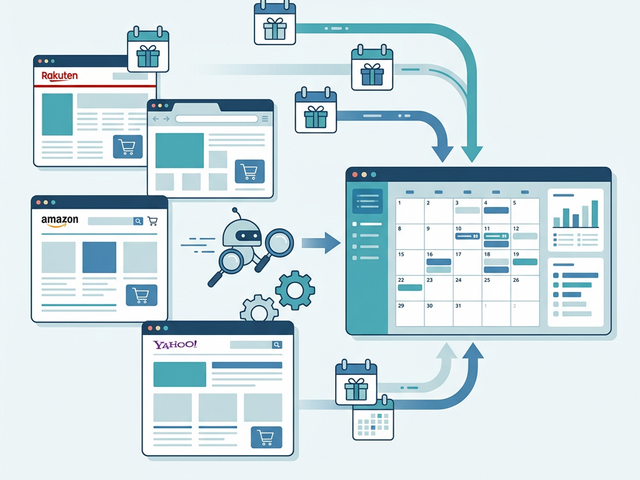
EC events such as Rakuten Super Sale, year-end gift sales, and shopping marathons are automatically collected through ICS Calendar Integration. Spontaneous sales are also detected and reflected in the calendar using AI scraping and search APIs.
Three ways to collect events
| Method | Explanation |
|---|---|
| ICS Automatic Synchronization | Automatically imports event information from external ICS calendar feeds. AI scraping/search API detects sudden sales. |
| Automatic Generation of Annual Regular Events | The "Generate Annual Regular Events" button automatically registers a full year's worth of events such as Rakuten Super Sale (4 times a year), year-end gift sales, and marathon events (monthly). |
| Manual Addition | Manually register your company's events or local events using the "+ Add Event" button. |
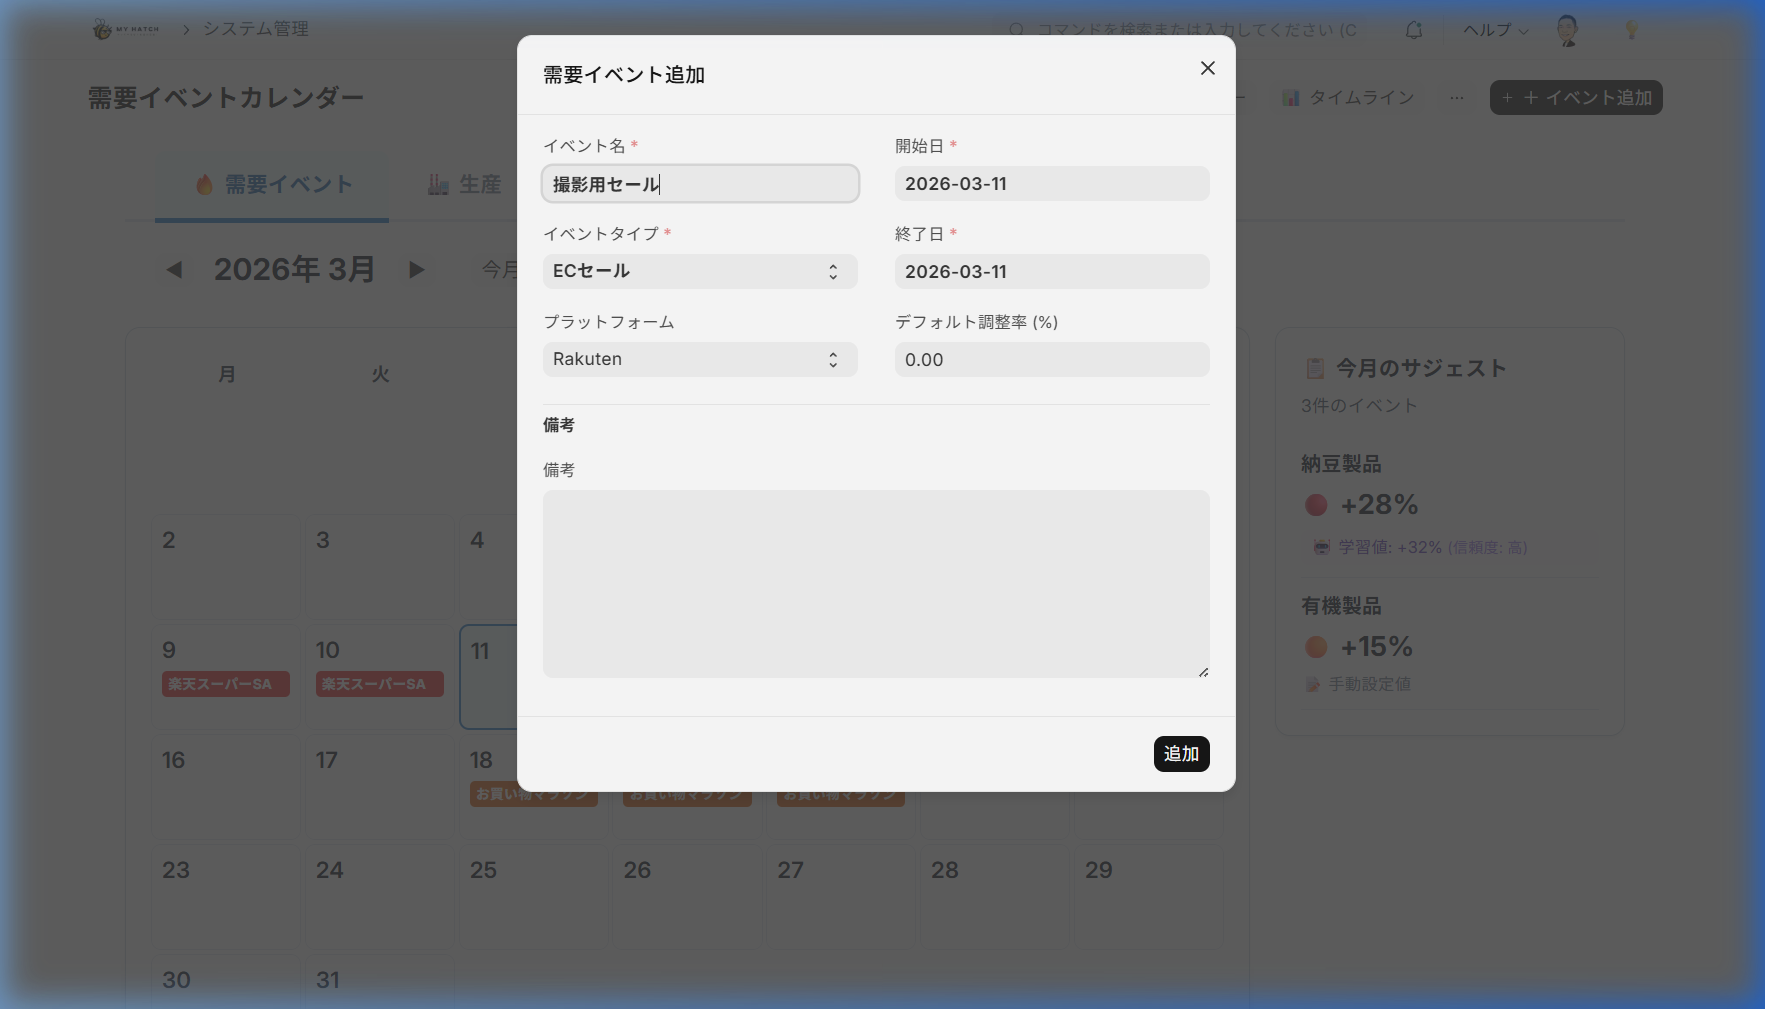
Steps to add an event
- Click the "+ Add Event" button in the upper right corner of the demand calendar.
- Enter the following on the screen.
- Event Name: Example: "Rakuten Super Sale"
- Event Category: E-commerce sale / National event / Company event
- Platform: Rakuten/Amazon/Yahoo! etc. (for e-commerce sales)
- Start Date / End Date
- Impact (%): What percentage increase compared to normal conditions (Example:
35(+35%)
- Register using the "Add" button. It will appear as a colored bar on the calendar.
Indicators of Impact
The "impact level" during registration indicates the percentage increase compared to normal production volume.
| Level | Influence | Meaning | Specific Example |
|---|---|---|---|
| Significantly increased production | +30% or more | More than 1.3 times the normal amount | Rakuten Super Sale, year-end gift season |
| Increased Production | +15-29% | 1.15-1.29 times the normal amount | Mid-year gifts, marathon |
| Slightly increased production | +5 to 14% | 1.05 to 1.14 times the normal amount | Company campaign, double points days |
| Normal | 0-4% | Almost normal | Normal business days |
This guideline will also be automatically improved by AI.
The impact levels shown above are only initial values. Through the "prediction accuracy feedback" explained in Scene 4, the AI automatically learns from the discrepancies between predictions and actual results for each event, and the recommended impact levels for subsequent events are automatically updated to more accurate values. The more you use it, the more it evolves into a guideline optimized for your company's item characteristics and event trends.
The Past and the Future
| Up until now | Up to now |
|---|---|
| Manually check sale information from each e-commerce site for 30 minutes | Automatic synchronization with ICS integration, and detect sudden sales |
| Manually enter each year's sales dates | Automatically generate a full year's worth with one click |
Scene 3: Review and fine-tune AI predictions
The forecast dashboard allows you to view and edit the item x daily forecast quantity calculated by AI in a table format. It features two forecast engines: one for preliminary forecasts and one for e-commerce.
Screen URL:/app/forecast-adjustment
Two prediction engines
| Engine | Prediction Target | Prediction Period | Training Data |
|---|---|---|---|
| Preliminary Order Forecast | Preliminary orders for supermarkets and mass retailers | 8 weeks ahead | Past preliminary order data (item x customer x day) |
| EC Forecast | Orders from Rakuten, Amazon, and Yahoo! | 2 weeks ahead | Past 90 days of EC order data |
Both engines use Meta's Prophet (time-series AI forecasting) and incorporate e-commerce sales events as special days to reflect the surge in demand during sales periods in their forecasts.
Things to do
- Open the forecast dashboard.
- Select either "Preliminary Forecast" or "EC Forecast" from the tabs at the top.
- Check the table to see the predicted quantity for each item per day.
- Adjust all items using the bulk adjustment button to match the sale period.
- +5% / +10% / +20%: Increased production before the sale
- -5% / -10% / -20%: Adjustments after the sale
- Custom %: Adjust to any percentage.
- The quantity of individual items can also be edited directly by double-clicking the cell.
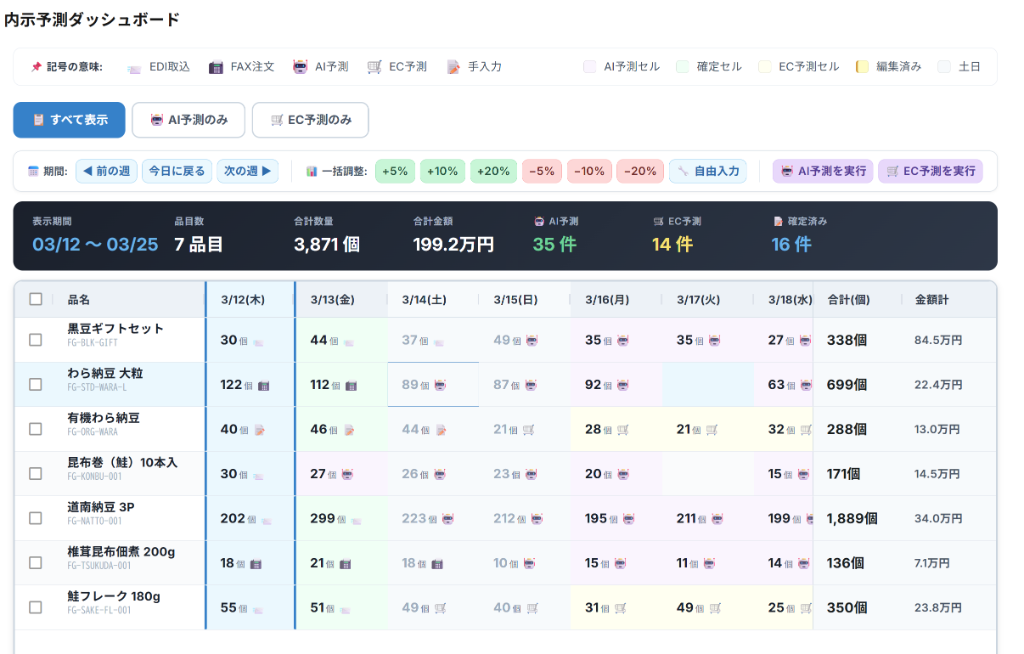
Summary Display
The summary bar at the top of the screen always displays the following aggregated values:
| Item | Contents |
|---|---|
| Period | Current date range |
| Number of items | Number of items to be predicted |
| Total Quantity | Sum of predicted quantities for all items |
| Total Amount | Total Estimated Sales Amount |
| Preliminary Forecast / EC Forecast / Confirmed | Number of entries by data type |
The Past and the Future
| Up until now | From now on |
|---|---|
| Copy last week's results from Excel and do the calculations manually, 1 hour | Check the AI's predictions and just adjust by ±% in one go, 5 minutes |
| Enter the quantity individually for each item | Add +10% to all items together → Adjust individually only for the items you need |
Scene 4: Improve prediction accuracy through feedback
The greatest feature of this system is its self-learning mechanism, which improves the accuracy of the AI the more you use it. It automatically compares predictions with actual results and automatically readjusts internal parameters.
Accuracy Panel
The demand calendar's demand events tab includes a "Forecast Accuracy" panel where you can check the forecast accuracy for each event and item group.
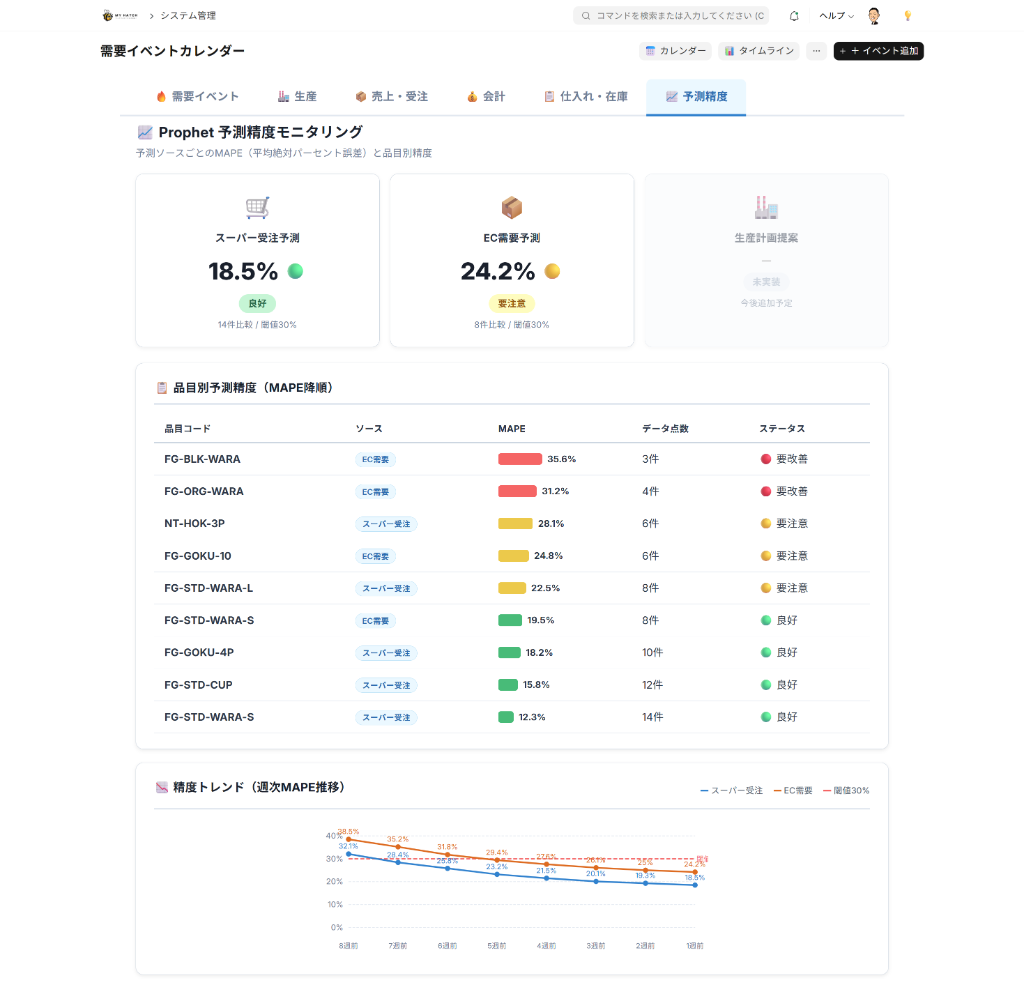
| Column | Content |
|---|---|
| Event | Name of the target EC event |
| Item Group | Item Group Name |
| Forecast | Forecasted production increase rate (%) during the event period |
| Results | Actual sales growth rate (%) |
| Difference | The difference between the forecast and the actual result. Green if within ±5%, yellow if within ±15%, and red if greater than that. |
| Accuracy | Accuracy Score (out of 100 points) |
Production Proposal Chart
The "Production Suggestion" chart allows you to compare manual settings and AI learned values side-by-side in a bar graph for each item group. You can use the AI's learned influence from past events to improve your manual settings for the next time.

Automatic parameter adjustment
If the accuracy falls below the baseline, the AI will automatically readjust the Prophet's internal parameters. No manual intervention is required.
| Item | Mechanism |
|---|---|
| Accuracy Measurement | Automatically measures the degree of discrepancy between prediction and actual results (MAPE: Mean Absolute Error Rate) |
| Automatic Adjustment | If accuracy is low, the AI will exploratoryally adjust internal parameters to find the optimal value. |
| Execution Timing | Forecasts are automatically executed weekly, and e-commerce forecasts are automatically executed daily. |
To be done (monthly review)
- Check the "Forecast Accuracy" panel on the demand calendar.
- Focus on the item groups with differences shown in red.
- Compare AI learned values and manual values in the production proposal chart.
- When registering for the next month's event, update the impact level based on the learned values.
The Past and the Future
| Up until now | Up to now |
|---|---|
| No mechanism for improvement if predictions are wrong | Automatic measurement with MAPE, visualizing differences in green, yellow, and red |
| Parameters are fixed | Parameters are automatically readjusted when accuracy decreases |
| Repeating the same mistakes | Improve the impact next time based on AI learning data |
Tips for Use
- AI is just a starting point: AI predictions are just a starting point. The final quantity can be freely adjusted by taking into account the CEO's experience. We will improve accuracy not by "leaving everything to AI," but by "AI + experience."
- Check early before the sale: The impact of e-commerce events will affect order preparations several days before the start date. Check the calendar at least a week in advance.
- Impact level can be changed later: You can adjust the impact level at any time by clicking on the row in the event list.
- Bulk Registration at the Beginning of the Year: If you run "Generate Annual Regular Events" once at the beginning of the year, your major e-commerce sales will be automatically registered.
- Linked with the order progress board: Predicted values Order progress board It will be automatically reflected. No further action is required.
Summary of this article
- Demand forecasting is a hybrid of AI + CEO experience, enabling production planning that doesn't rely on intuition.
- The demand calendar allows you to get an overview of e-commerce sales and production performance on a single screen, and the five tabs provide a complete picture.
- Prediction accuracy is automatically improved and will be optimized for your company the more you use it.