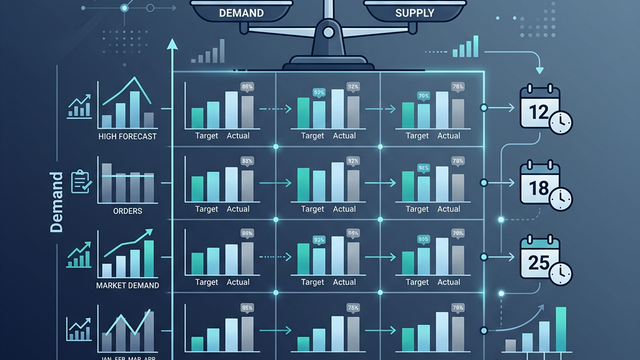
Order progress board
This list of items and dates displays preliminary orders, orders, Kanban cards, production plans, shipping schedules, and inventory trends all on one screen. It serves as a reference screen for sales and production teams to coordinate figures using the same view.
Related Articles How to enter orders is Sales workflow See below. This screen is specifically for viewing the progress after input. What are the specific instructions and procedures from the manufacturer? Work Instructions List / Production Dashboard We will start from here.
What you can do on this screen
The order progress board is a screen that displays a list of each item, showing "when and how much is expected to be sold" and "when and how much is expected to be produced/procured," broken down by date.
- You can see customer preliminary orders (tentative orders), confirmed orders, production plans, shipping schedules, and inventory increases/decreases in a single table.
- The purpose is to prevent stockouts and overproduction by having sales, production management, and shipping personnel all view the same screen.
Screen URL:/app/order-management
Who will use it and for what purpose?
| Responsible Person | Main Usage |
|---|---|
| Sales | Check the difference between customer preliminary orders and confirmed orders, the progress of delivery date responses, and consistency with the shipping schedule. |
| Sales Manager | Overview of demand trends and stockout alerts by item group and customer |
| Production Management | Directly input and update daily production plans and perform Material Requirements Planning (MRP) |
| Shipping Manager | Confirmation of shipping instructions (draft → final) and scheduling |
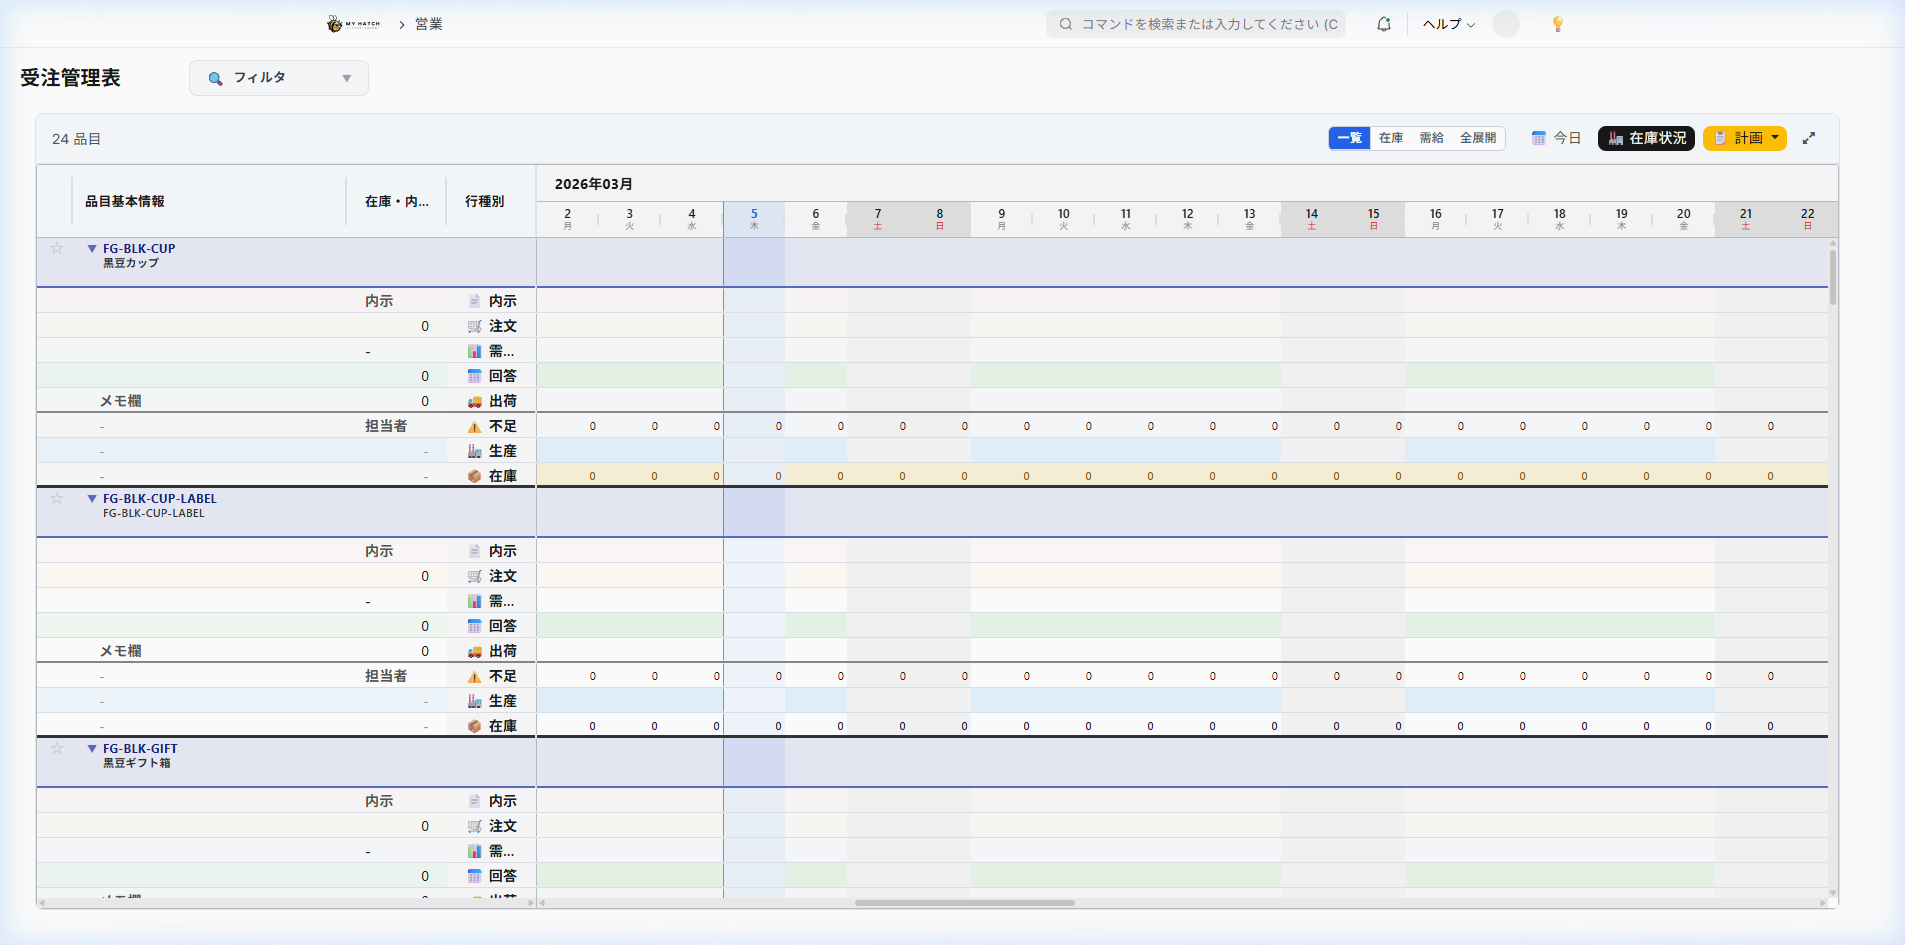
Overall view of the screen
The screen is divided into two main areas.
| Area | Role |
|---|---|
| Left side: Item List | A list of products and parts managed within the company. Select the item you want to view from here. |
| Right side: Supply and Demand Matrix | Displays the daily demand, supply, and inventory trends for the selected item, row by row. |
At the top, there is a summary bar (showing current inventory, estimated totals for this month to the month after next, etc.), which allows you to see the overall status of each item at a glance.
Left side: Item list
The items are displayed in a list using the company's internal management part numbers. Customer-specific part numbers (customer part numbers) are also displayed together.
Filtering conditions
| Item | Contents |
|---|---|
| Year and Month | Select the year and month you want to display |
| Item Code | Enter part of the internal part number or customer part number to search |
| Item Name | Enter part of the item name to search |
| Item Group | Filter by Item Category (e.g., Finished Products, Raw Materials) |
| Customer | Show only items linked to a specific customer |
| Person in Charge | Filter by items for which a person in charge has been assigned |
| Warning Included | Only items with warnings such as being out of stock are displayed |
| Items for Sale | Filter by items to sell/items not to sell |
| Active Items | Filter by In Use/Stopped |
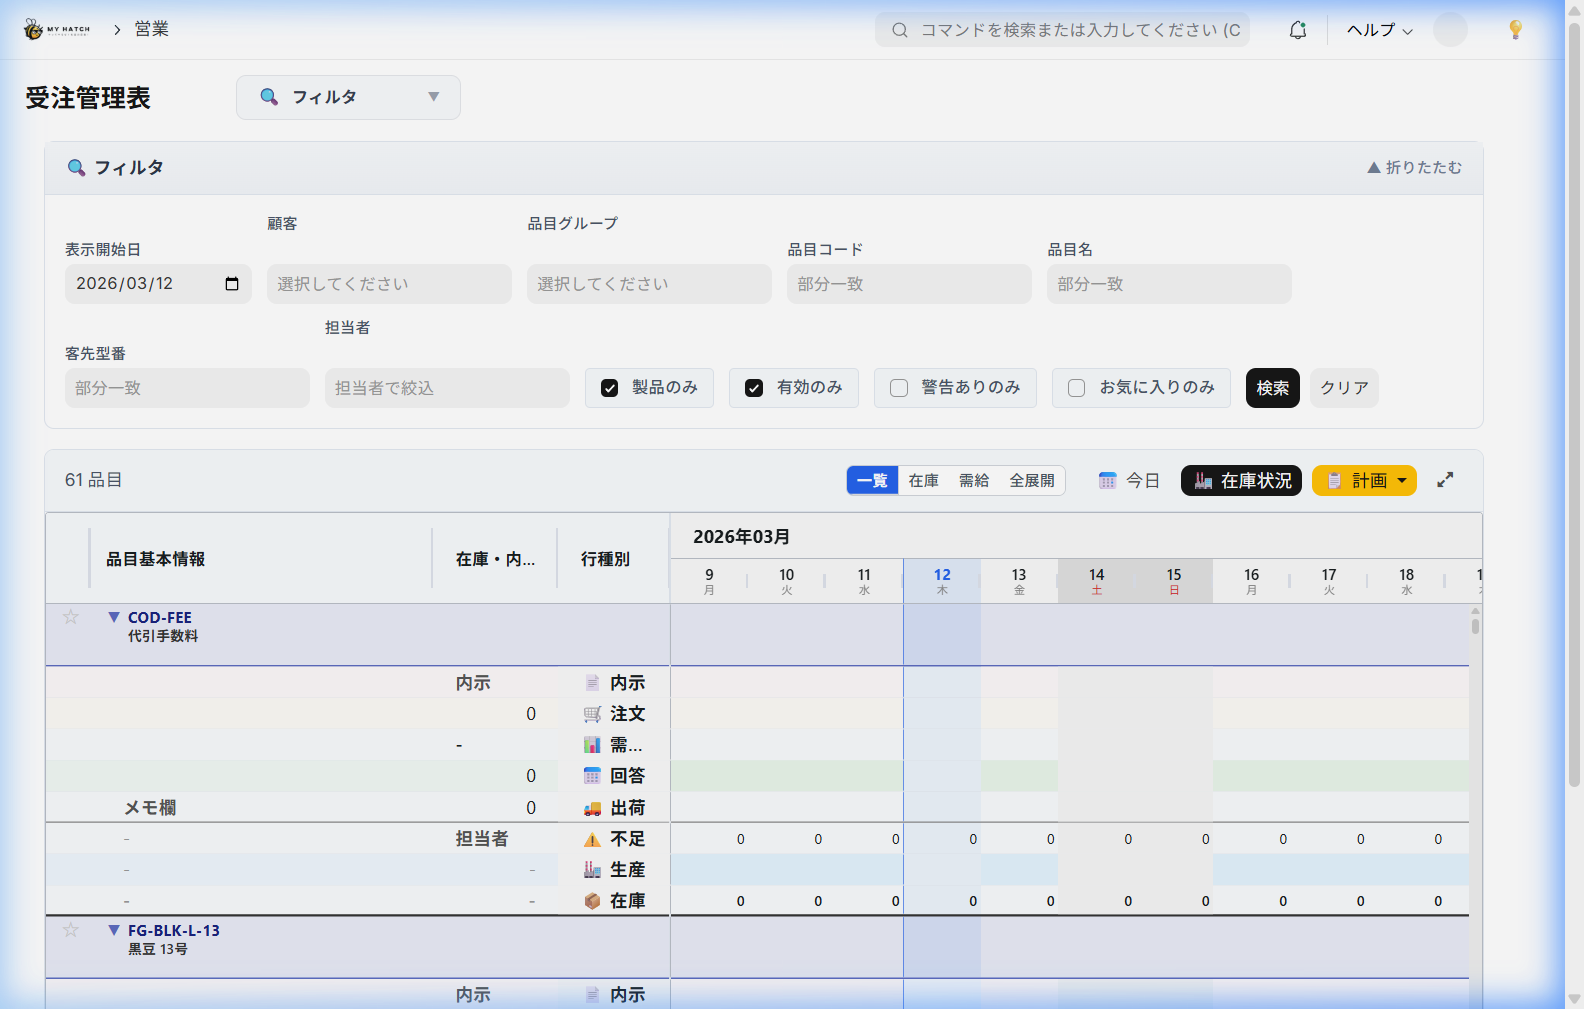
Right side: Supply and demand matrix (table showing daily movements)
When you select an item, a table will be displayed with dates in the columns and items in the rows. There are 8 types of rows, starting from the top.
| # | Row name | Content |
|---|---|---|
| 1 | Preliminary Order | The quantity received in advance from the customer, indicating "we plan to order around this much." This is automatically imported if EDI (Electronic Data Interchange) is used. |
| 2 | Order | Officially confirmed order quantity |
| 3 | Delivery Response | The quantity that was responded to the customer with "We will deliver this many units on this day." |
| 4 | Kanban (Morning Delivery) | Quantity of Kanban to be used for morning delivery |
| 5 | Kanban (Daytime Delivery) | Quantity of Kanban to be used for daytime delivery |
| 6 | Production Plan | Quantity planned to be produced at the factory (including a breakdown of progress) |
| 7 | Shipment (Planned/Confirmed) | Quantity to be shipped (distinguishing between planned and confirmed) |
| 8 | Inventory Trends | Daily Inventory Forecast |
Summary bar (top of the table)
| Item | Contents |
|---|---|
| Product Inventory | Current inventory of finished products in the warehouse |
| Work-in-Progress Inventory | Current inventory of items in the process of being manufactured (still in their containers) |
| Safety Stock | The minimum amount of inventory determined for each item that we absolutely do not want to run out of. |
| Total of Notifications | Total of notifications for the current month / next month / the month after next |
Work in progress by process
The summary section also displays the quantity of work-in-progress for each process, up to a maximum of 9 processes. For example, you can see how much work-in-progress there is at each stage of the production line, such as "Soaking: 120 pieces → Steaming: 60 pieces → Fermentation: 30 pieces".
Basic Operations
1. Check order status (for sales staff)
By filtering by customer or contact person on the left and then looking at the Order/Delivery Confirmation/Shipping rows on the right, you can see the order status and shipping forecast for each customer all on one screen.
Common uses:
- "What are the planned shipments to Company A this week?" → Filter by customer = Company A and check the shipment line.
- "What is the difference between this month's preliminary orders and confirmed orders?" → Cumulative difference between preliminary orders and confirmed orders.
- "Which orders have not yet received a delivery date response?" → Extract items and dates for which orders have been received but a delivery response has not yet been given.
2. Input and modify production plans (for production management)
Click on a cell in the Production Plan Row of the matrix and enter the quantity.
- Simultaneous Editing Detection: If another user edits the same cell at the same time, a warning will be displayed (this is a mechanism to prevent overwriting accidents).
- Save: After entering your information, press the save button to save all entries at once.
3. Managing delivery responses (for sales)
You can perform the following actions to confirm delivery:
- Change Quantity: Click the cell to modify the answer quantity.
- Date Change: Change the date using drag-and-drop or the right-click menu.
- Status Change: Switch between Enabled/Pending/Cancelled
- Delete: Delete an answer that is no longer needed.
Because the results of delivery date adjustments with customers are directly reflected, records of phone and email correspondence become sales data.
4. Manually enter revisions to the internal notification.
In addition to importing via EDI, you can also manually revise the forecast.
- Right-click the target cell → Select "Register Revision".
- Enter the revised quantity, reason, and attached files.
- It will be automatically saved as part of the revision history.
5. Check for warnings (alerts)
The screen automatically performs calculations and displays warnings for any problematic areas.
| Warning | Conditions under which it is displayed |
|---|---|
| Inventory Shortage | There will be days when forecast inventory falls below safety stock |
| Changes in Forecast | Increase or decrease in quantity from the previous forecast, or advancement/delay in delivery date |
| Shipping Delay | Insufficient stock to meet shipping schedule |

By turning on "Warning" in the filter on the left, you can display only items with warnings. Just a 5-minute look first thing in the morning will give you an overview of the day's risks.
Production planning (3-channel compatible)
Planning Dashboard (/app/production-planning ) allows you to plan in the most optimal way for each sales channel.
| Channels | Planning Approach | Workflow |
|---|---|---|
| Large Overseas Orders | Create production orders directly from confirmed orders | Select orders → Create production orders in bulk |
| Super Daily | Combine orders and preliminary orders to calculate the required quantity of finished products, and then break it down into component parts. | Check and correct the breakdown results → Create manufacturing orders. |
| EC Mall (Immediate Delivery) | Automatically detects and replenishes items that fall below safety stock levels | Automatic detection → Creates batch production orders |
Superchannel Part Deployment Preview
You can expand the demand for finished products according to the bill of materials (BOM) and check the required amount of work-in-progress all at once.
- Specify the target period (preliminary notification period/order period).
- Use the "Preview" button to display the required quantity for each work-in-progress item.
- Adjust the quantity as needed (※If the pot size is in units of 69kg, it is recommended to round up to that unit).
- The "Create Manufacturing Order" option will generate a batch of draft orders.
Automatic replenishment for e-commerce marketplaces
The system automatically detects items that meet the following conditions and creates manufacturing orders for replenishment.
- The sales channel is "EC Mall (Immediate Delivery)" and safety stock is set.
- Current inventory < Safety stock
- Replenishment amount = Safety stock × 1.2 (20% margin) - Current inventory
Requirement calculation (MRP)
MRP is a function that automatically calculates the items and quantities that need to be produced or purchased. This is an abbreviation for Material Requirements Planning, a term commonly used in the manufacturing industry.
MRP execution location
MRP Execution Center/app/mrp-run-center ) This is how you execute it. After finding a shortage on the order progress board, it is common practice to go to this screen and execute the action.
Calculation Flow
- Collect supply and demand
- Demand side: Confirmed orders, preliminary orders (optional)
- Supply side: Order placed, production order, received
- Forecast daily inventory Starting from the current inventory, we subtract daily demand and add supply to calculate the remaining inventory.
その日の在庫 = 前日在庫 − その日の需要 + その日の供給
- Detection of shortages Find the day when projected inventory falls below safety stock.
不足量 = 安全在庫 − 予測在庫
- Should I make it? Or buy it?
- Items with a Bill of Materials (BOM) → Make (Propose a manufacturing order)
- Items without a bill of materials → Buy (Propose a purchase request)
- Expand the bill of materials (up to 5 levels)
- Unfold the components of the finished product in order and calculate the required quantities of raw materials.
- Unit conversions (kg ↔ g ↔ pieces, etc.) are also performed automatically.
- Consider lead time
- Items to purchase: Refer to the delivery date for each supplier → Standard delivery date for the item.
- Items to produce: Refer to the item's manufacturing lead time.
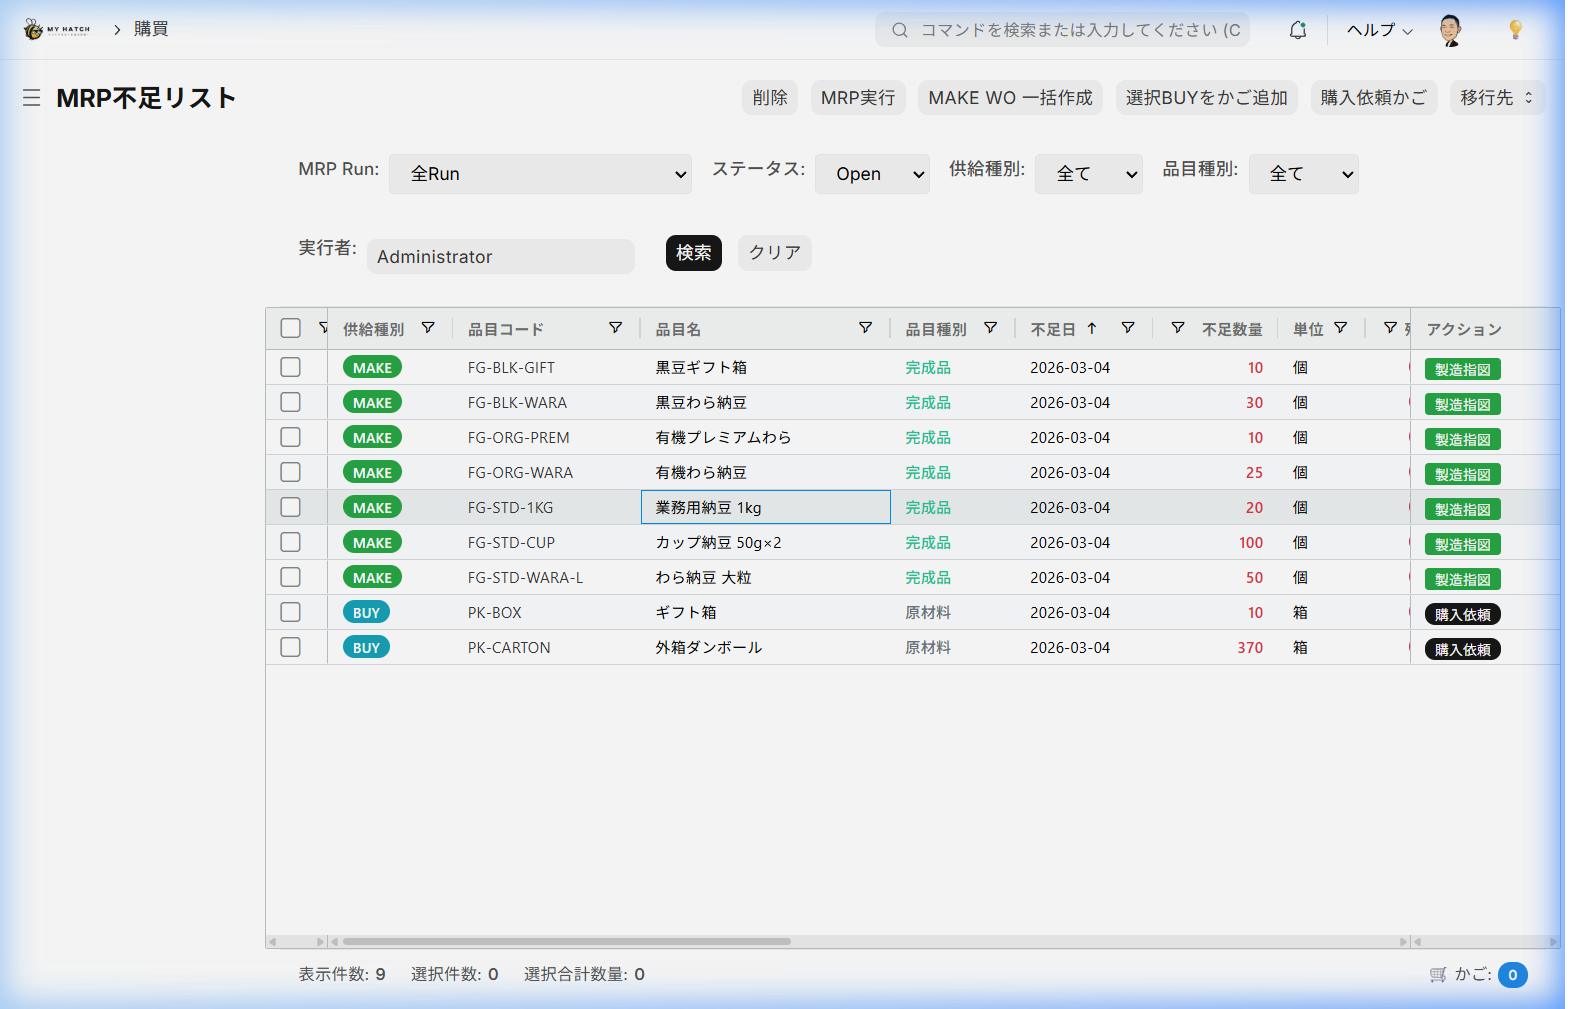
Checking the calculation results
The MRP results are saved, and the following information can be viewed:
| Item | Contents |
|---|---|
| List of items in short supply | List of items that may fall below safety stock levels |
| Shortage Date | When is the stock expected to run out? |
| Shortfall | Additional quantity needed |
| Category | Make/Buy |
| Proposed Action | Create production order / Create purchase requisition |
From Results to Next Actions
From the calculation results screen, you can perform the following operations with a single click.
- Batch creation of manufacturing orders: Create draft orders for all items to be manufactured at once.
- Bulk Purchase Requisition Creation: Create a bulk purchase requisition for all items you want to buy.
- Shopping Cart: Add purchase requests to the cart and convert them all into purchase orders later (→ Purchase Request Cart )
Holiday Management
The system displays Saturdays, Sundays, and public holidays in a color-coded matrix, according to the holiday calendar registered by the company. When creating a plan, you can easily distinguish between working days and non-working days at a glance.
Tips for Use
- The 5-Minute Morning Rule: By filtering by "Warnings" and checking for just 5 minutes, you can address the day's risks on the same day.
- Sales and production teams view the same screen: When discussing delivery dates over the phone, having both parties open this screen prevents discrepancies in the numbers.
- Conversion Rate from Informal Order to Order: By looking at the ratio of informal orders to orders received over time, we can understand the accuracy of customer orders.
- Customer Filter × End-of-Month Check: Filtering by customer on the last day of the month and checking for cases that cross the closing date can help prevent problems.
- Do not ignore alerts: The warning icon will disappear automatically once the issue is resolved. If it does not disappear, it is a data-related problem, so please contact your administrator.
FAQ
Q: I seem to recall seeing an article about this in the manufacturing manual before.
Previously/manual/manufacturing/order-management It was previously located at [location]. The actual screen is publicly available as the "Order Progress Board" in the "Selling" workspace on the sidebar, so it was moved to the sales-oriented section in April 2026. The old URL will be automatically redirected.
Q: Can I enter orders directly from this screen?
No, this screen is for monitoring progress and updating plans. Order entry is for... Individual Order Entry , EDI import , FAX Order Please do so through the Order Hub or similar.
Q: Are inputting a production plan and creating a manufacturing order the same thing?
No, they are different things.
- Production Plan: The planned value of "how much to produce and when" is registered in the cells on this screen.
- Manufacturing Order: An instruction document that issues instructions for actual manufacturing. Work Instructions List Create from
The conversion from planned values to production orders is done in the MRP Execution Center or the Planning Dashboard.
Q: What happens when there is a one-to-many relationship between customer part numbers and internal part numbers?
Customer part numbers are managed using customer part number mapping. On the order progress board, they are displayed in a unified manner by internal part number, so multiple customer part numbers associated with the same internal part number can be seen together on a single line. If you want to view them separately from a customer's perspective, please use the customer filter in conjunction with this.
Q: What is the relationship with demand forecasting (Prophet AI)?
The preliminary forecast and Prophet forecast values are reflected as preliminary forecast lines on this screen or as proposed values in the production plan. For details, see below. Demand forecasting (AI) Please refer to the following.
Next Steps
- View and edit individual order details → Individual Order Entry
- Confirm shipping schedule → Shipping slip
- Specific instructions and operations from the manufacturing side → Work Instructions List
- Run MRP to update the supply plan → MRP Execution Center (
/app/mrp-run-center)